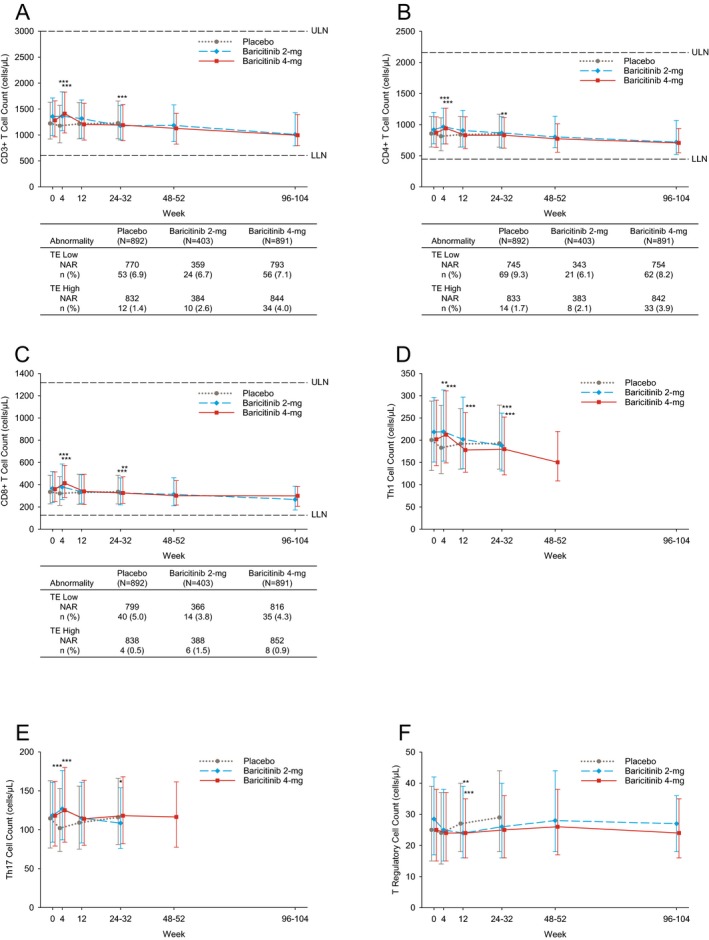
Figure 2.

T cell counts during treatment. Counts of CD3+ cells (A), CD4+ cells (B), CD8+ cells (C), Th1 cells (D), Th17 cells (E), and Treg cells (F) are shown. Values are the median and 25th–75th percentiles. A–C include patients with TE high T cell count and TE low T cell count. Values are the number (%) of the NAR. * = P ≤ 0.05; ** = P ≤ 0.01; *** = P ≤ 0.001 versus placebo, based on the least squares mean difference change from baseline. See Figure 1 for definitions.
