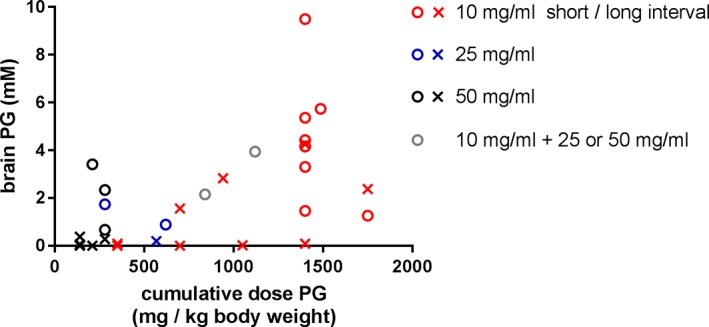
Figure 3.

Scatterplot of estimated brain concentration of propylene glycol (PG) vs. total dose PG per kg body weight. Colors indicate the formulation of phenobarbital administered (red: 10 mg phenobarbital/ml, blue: 25 mg phenobarbital/ml, black: 50 mg phenobarbital/ml, gray: combination of 10 mg phenobarbital/ml and either 25 or 50 mg phenobarbital/ml). The interval between the last dose of phenobarbital and MR examination is indicated with circles (<30 hours) and crosses (>30 hours).
