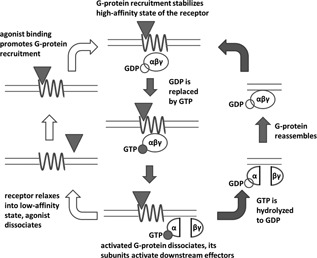
Figure 2.

GPCR activation (left circuit, open arrows) and GTP cycle (right circuit, solid arrows). As in Figure 1, the agonist is represented by a triangle, the G‐protein by an ellipse and the receptor by a sinusoid line. The center of the figure shows the “ternary complex” consisting of agonist, receptor and G‐protein. GPCR, G‐protein‐coupled receptor; GTP, guanosine triphosphate
