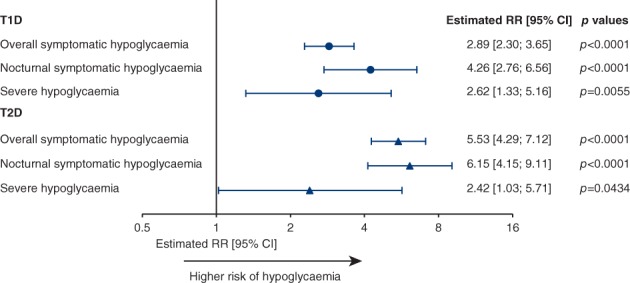
Figure 1.

Linear regression analysis of the effect of day‐to‐day fasting SMBG variability (SDs) on rate of hypoglycaemia. Data were based on the full analysis set during the maintenance period. Abbreviations: CI, confidence interval; RR, rate ratio; SMBG, self‐monitored blood glucose; T1D, type 1 diabetes; T2D, type 2 diabetes
