
Figure 3.
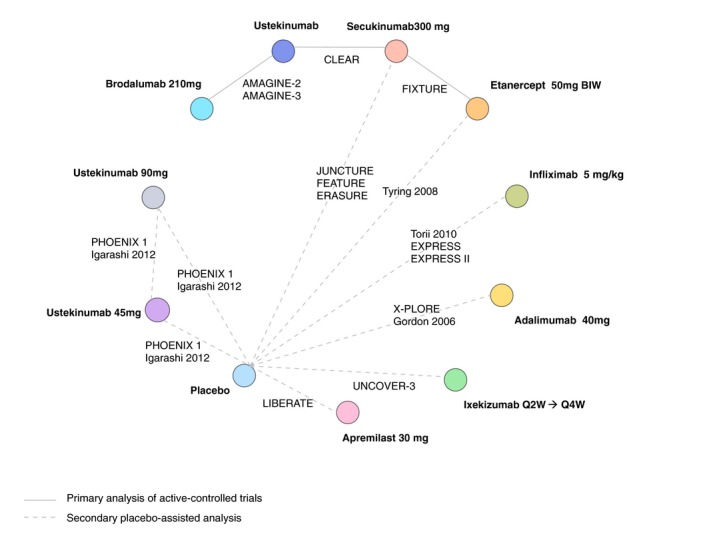
Network diagram of Psoriasis Area and Severity Index (PASI) responses – primary and secondary analyses.
Official websites use .gov
A
.gov website belongs to an official
government organization in the United States.
Secure .gov websites use HTTPS
A lock (
) or https:// means you've safely
connected to the .gov website. Share sensitive
information only on official, secure websites.
Network diagram of Psoriasis Area and Severity Index (PASI) responses – primary and secondary analyses.