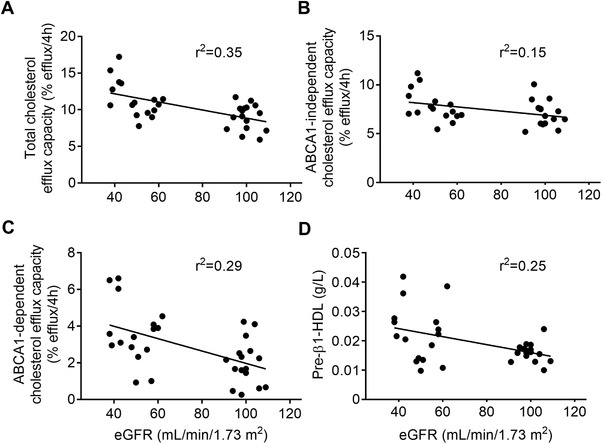
Figure 1.

Correlation of baseline estimated glomerular filtration rate, cholesterol efflux capacity, and pre‐β1‐HDL. Shown are individual data points (n = 32) and regression lines for cholesterol efflux capacity; total (A), ABCA1‐independent (B), ABCA1‐dependent (C), and pre‐β1‐high density lipoprotein (D) by baseline estimated glomerular filtration rate (eGFR). Linear regression analysis showed that eGFR was significantly correlated with all parameters shown at baseline (p values not shown). Goodness of fit shown as r2.
