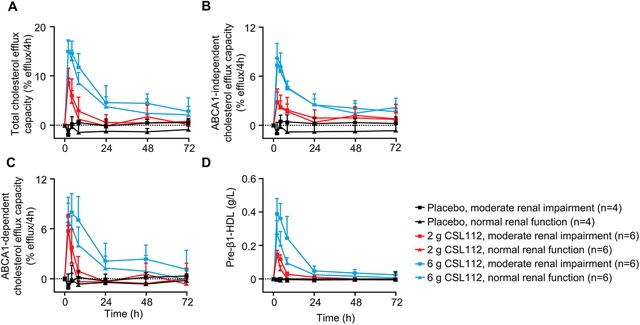
Figure 3.

Cholesterol efflux capacity and pre‐β1‐HDL following infusion of CSL112. Shown are baseline‐corrected mean ± standard deviation cholesterol efflux capacity; total (A), ABCA1‐independent (B), ABCA1‐dependent (C), and pre‐β1‐high density lipoprotein (D) by dose group and renal function group from predose to 72 hours postdose.
