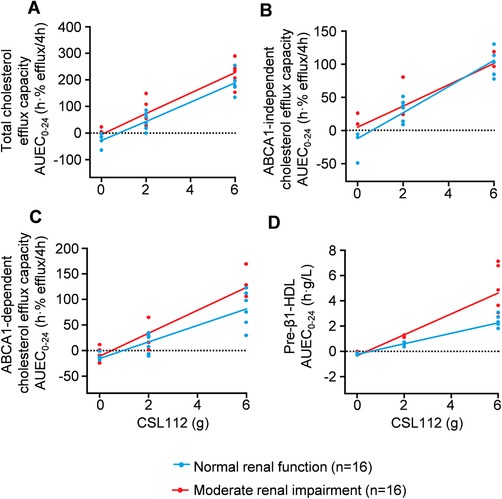
Figure 4.

Dose‐dependent increases in cholesterol efflux capacity and pre‐β1‐HDL following infusion of CSL112. Shown are individual data points for the area under the effect curve from 0 to 24 hours (AUEC0‐24) for cholesterol efflux capacity; total (A), ABCA1‐independent (B), ABCA1‐dependent (C), and pre‐β1‐high density lipoprotein (D). Regression lines for area under the effect curve over 24 hours (AUEC0‐24) by CSL112 dose for renal function groups were compared for parallelism, as described in the Methods section. Slopes were not significantly different for total, ABCA1‐independent, or ABCA1‐dependent cholesterol efflux capacity. The dose‐dependent increase in pre‐β1‐HDL was significantly greater for subjects with moderate renal impairment than for those with normal renal function.
