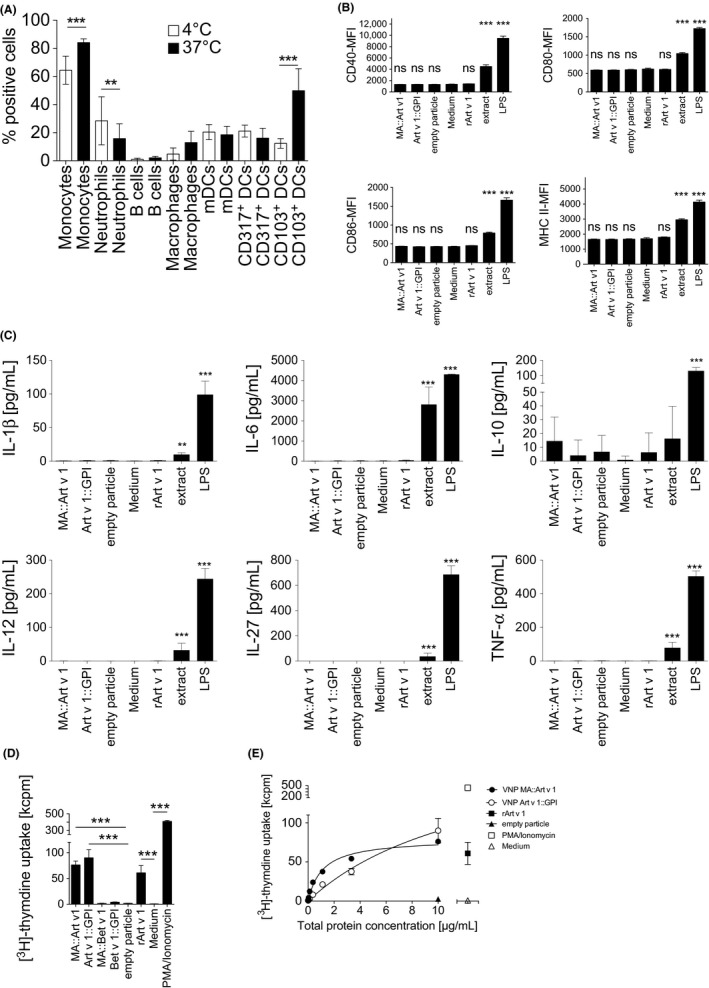
Figure 3.

Uptake and immunostimulatory capacity of allergen‐expressing virus‐like nanoparticles (VNP). A, Binding and uptake of fluorescent MA::mCherry VNP by the indicated splenic cell types. Open bars indicate positive cells at 4°C, filled bars show positive cells at 37°C. B, Shown is flow cytometry expression of CD40, CD80, CD86, and MHC class II (HLA DR1) on bone marrow‐derived dendritic cells (BMDC) after co‐incubation with MA::Art v 1 VNP, Art v 1:: glycosylphosphatidylinositol (GPI) VNP, empty VNP (all at 10 μg/mL), medium alone, rArt v 1 (1 μg/mL), aqueous mugwort pollen extract (100 μg/mL), or LPS (100 ng/mL) for 24 h. C, Shown are the cytokine levels of IL‐1β, IL‐6, IL‐10, IL‐12, IL‐27, and TNF‐α secreted by BMDC (2 x 10⁵/well in 200 μL) upon co‐incubation with VNP expressing MA::Art v 1, Art v 1::GPI, empty particles, rArt v 1 (1 μg/mL), medium alone, aqueous mugwort extract (100 μg/mL), or LPS (100 ng/mL) for 24 h. D, Shown is proliferation of splenocytes of TCR/DR1 mice incubated with MA::Art v 1 VNP, Art v 1::GPI VNP, empty VNP (10 μg/mL), rArt v 1, (0.5 μg/mL), medium alone, or PMA/ionomycin (10−7M PMA, 120 ng/mL, respectively) for 72 h followed by a 16‐h methyl‐[3H]‐thymidine pulse (1 μCi/well). E, Shown is dose‐dependent proliferation of splenocytes from TCR/DR1 tg mice incubated with increasing amounts of MA::Art v 1 VNP or Art v 1::GPI VNP. Data show the summary of three independent experiments (A‐E) performed in triplicates. kcpm, kilo counts per minute; Kruskal‐Wallis test followed by Dunn's correction (A, D, E) or one‐way ANOVA followed by Tukey's correction (B, C). ns, not significant; **P<0.01; ***P<0.001
