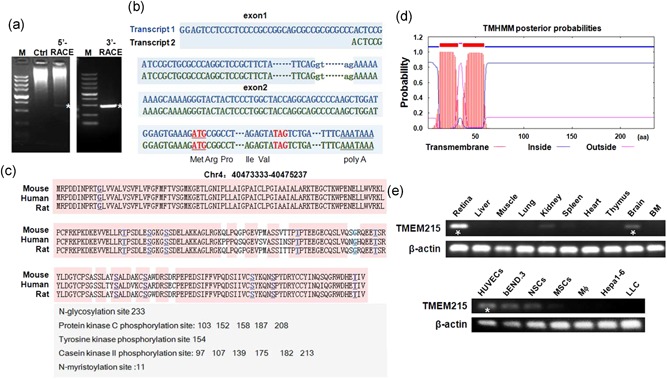
Figure 1.

Structure of the TMEM215 gene and tissue distribution of its transcripts. (a) Electrophoresis of PCR products of 5′‐RACE and 3′‐RACE. The 700 bp 5′‐RACE band and the 450 bp 3′‐RACE band were marked by white asterisks. Control (Ctrl), not amplified by TMEM215‐specific primers. M, molecular weight markers (from the top, 5000, 3000, 2000, 1500, 1000, 750, 500, 250, and 100 bp). (b) Transcript 1 and transcript 2 of TMEM215. The transcript 2 starts 36 bp downstream of transcript 1. Exons are in capitals, while the splicing donor and acceptor in the intron are in lowercase. The translation starting codon (ATG) and terminating codon (TAG) are marked in red, and the putative poly(a)‐adding signal (AATAAA) is underlined. Parts of exons and intron sequences are omitted. (c) Alignment of the amino acid sequences of mouse, human, and rat TMEM215. Predicted N‐glycosylation site, protein kinase C phosphorylation sites, tyrosine kinase phosphorylation site, and casein kinase II phosphorylation sites are listed. (d) Prediction of transmembrane domain of TMEM215 using the TMHMM2.0 software (DTU Bioinformatics, Denmark). (e) Detection of TMEM215 transcripts in different types of cells and tissues by qRT‐PCR and electrophoresis, with β‐actin as a reference control. TMEM215 is highly expressed in retina, brain, and ECs, as indicated with white asterisks. ECs: endothelial cells; PCR: polymerase chain reaction; qRT‐PCR: quantitative reverse transcription‐polymerase chain reaction; RACE: 5′‐rapid amplification of complementary DNA ends [Color figure can be viewed at wileyonlinelibrary.com]
