Figure 1.

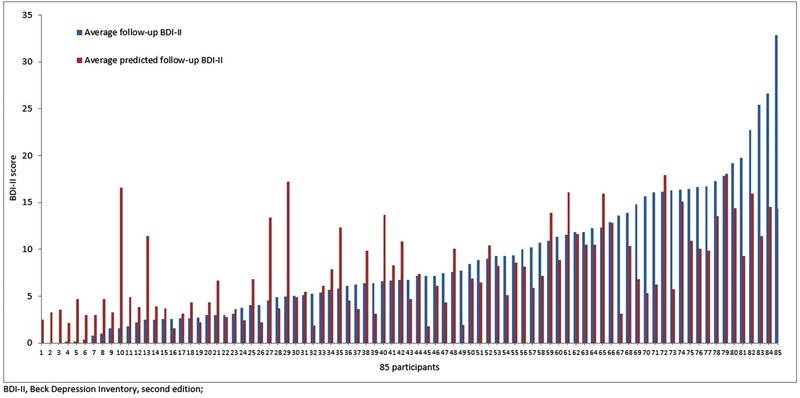
Bar plots showing predicted average Beck Depression Inventory (BDI‐II) scores and average observed BDI‐II scores for each participant during follow‐up

Bar plots showing predicted average Beck Depression Inventory (BDI‐II) scores and average observed BDI‐II scores for each participant during follow‐up