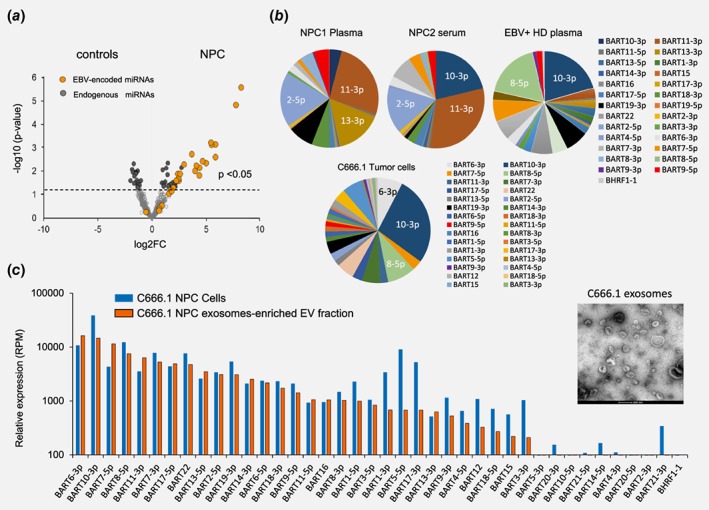
Figure 1.

small RNAseq reveals distinct circulating EBV BART‐miRNA profiles in NPC patients. (a) Volcano plot of RNA Illumina sequence analysis of EBV miRNAs in NPC patients (n = 5) and Healthy controls (n = 3). Each dot represents the type of EBV‐encoded miRNA (orange) and endogenous miRNA (gray). (b) EBV miRNA distribution in a NPC plasma (NPC1), serum (NPC2) sample and a healthy control (CTRL1) plasma sample compared to relative expression pattern as measured in C666.1 NPC tumor cells. Data are shown as percentage read counts. (c) Relative EBV miRNA expression in NPC C666.1 tumor cells and secreted exosomes. Data are shown as reads per million miRNA reads (RPM). EM image of pure exosomes isolated from NPC C666.1 cell line. Scale bar: 200 nm.
