
Figure 4.
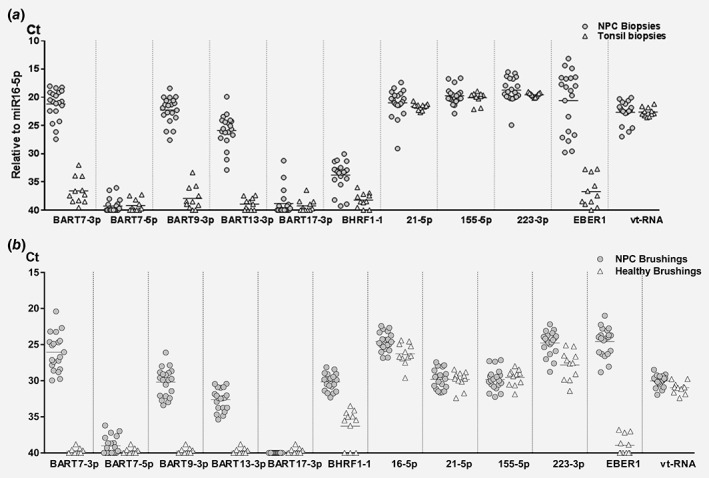
Heterogeneity of EBV‐miRNA expression profiles in primary NPC tumor tissue is reflected in NP brushings. (a) Normalized expression levels of EBV miRNAs and endogenous miRNAs in NPC biopsies (n = 20, gray dots) compared to tonsils (n = 11, white triangles). (b) Same as (a) but showed relative expression levels in NPC brushings (n = 20, gray dots) and healthy brushings (n = 11, white triangles). Data were presented as Ct values. Short horizontal lines represent the average.