
Figure 5.
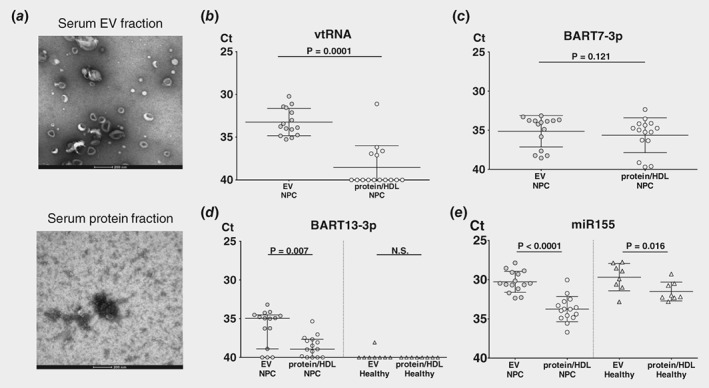
EBV BART13‐3p is selectively enriched in serum EVs from NPC patients. Sera from 18 NPC patients underwent Size Exclusion Chromatography. (SEC) to get fractionated into EVs and protein followed by stem‐loop RT and TaqMan. miRNA assays. (a) Transmission electron microscope (TEM) image of serum from NPC patient in EV fraction and protein fraction. Scale bar: 200 nm. miRNA expression levels of (b) endogenous vtRNA, (c) BART7‐3p, (d and e) BART13‐3p and miR155 respectively were measured by qRT‐PCR in extracellular vesicles (EVs) fractions and protein fraction of 18 NPC patients and 8 healthy control sera. The raw data is adjusted by volume input and presented as Ct values. Errors bars represent the averages of EV and protein fractions. Significance of differences were analyzed by Mann–Whitney test and the corresponding p‐values are indicated above the plots.