Figure 1.

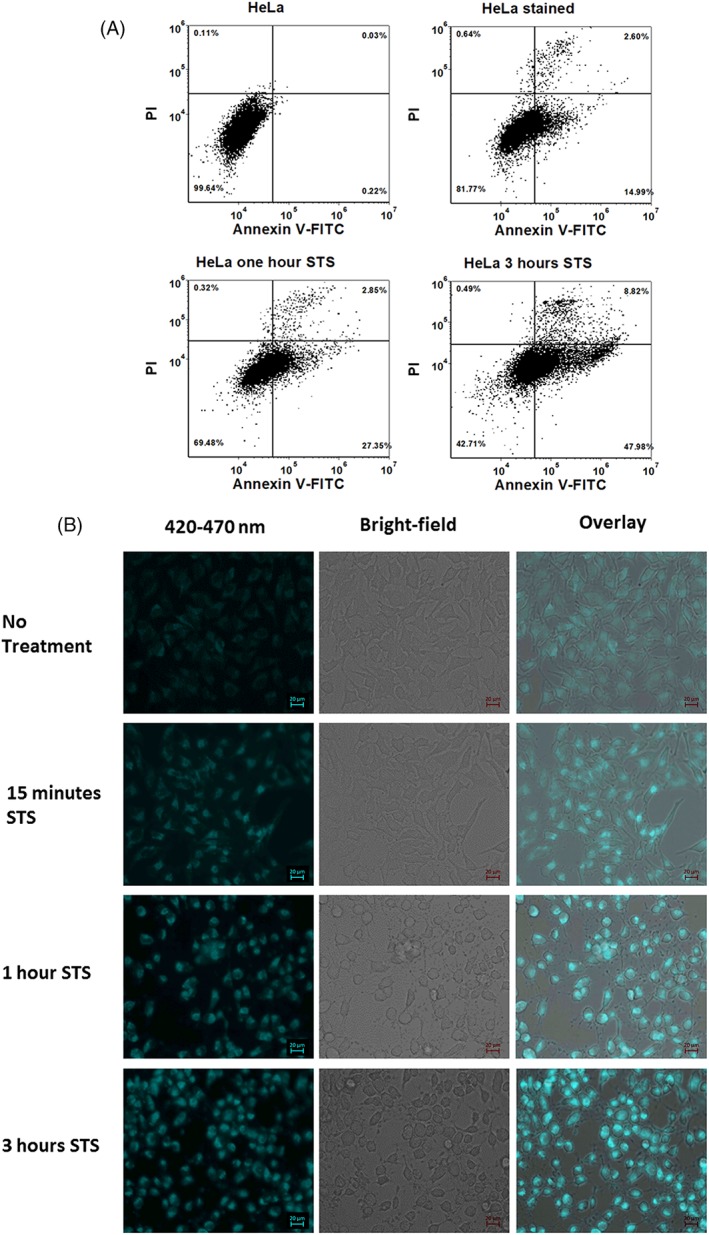
(A) Annexin V‐FITC Propidium Iodide (PI) binding assay for evaluation of apoptosis. 1 μM staurosporine (STS) was used to induce apoptosis in HeLa cells. Dot plot graphs generated from flow cytometric analysis (488 nm excitation) show percentage apoptotic cells in stained cells with no STS treatment (control), cells treated with STS for 1 h and cells treated with STS for 3 h. X‐axis represents fluorescence collected from channel with a 530/30 nm bandpass filter corresponding to Annexin V‐FITC. Y‐axis represents fluorescence collected from channel with a 585/40 nm bandpass filter corresponding to PI. Quadrant gates were generated using unstained HeLa cells as universal negative control. (B) Fluorescence microscopy of HeLa cells. Fluorescence images were obtained from unstained cells treated with STS to capture NADH fluorescence intensity. A 335–383 nm excitation filter and 420–470 nm emission filter were used. Bright‐field and fluorescence channels are overlaid. The scale bar for micrographs is 20 μm. [Color figure can be viewed at wileyonlinelibrary.com]
