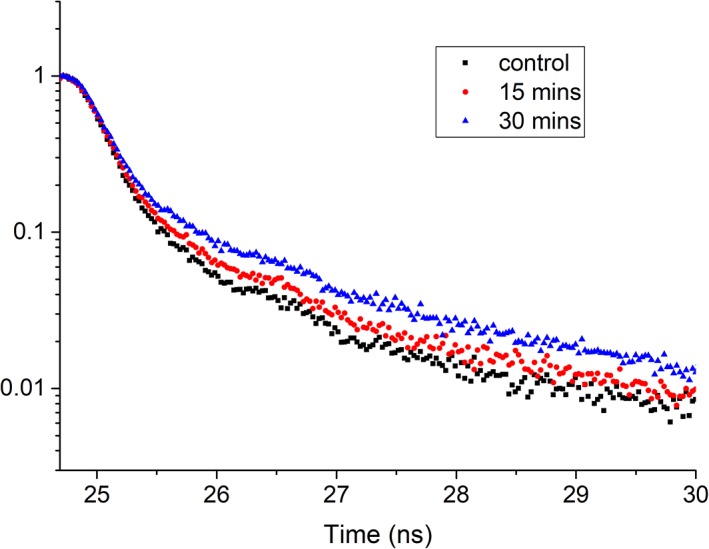
Figure 2.

Fluorescence decay curves from cuvette measurements of HeLa cells. Untreated cell sample (control, black squares) along with cells treated with STS measured after 15 min (red dots) and 30 min (blue triangles) show a shift in the decay kinetics. A 393‐nm peak wavelength laser diode was used for excitation and emission was captured using a 448/20 nm bandpass filter. The time calibration for this instrument was equivalent to 2.64078e‐2 ns/channel. [Color figure can be viewed at wileyonlinelibrary.com]
