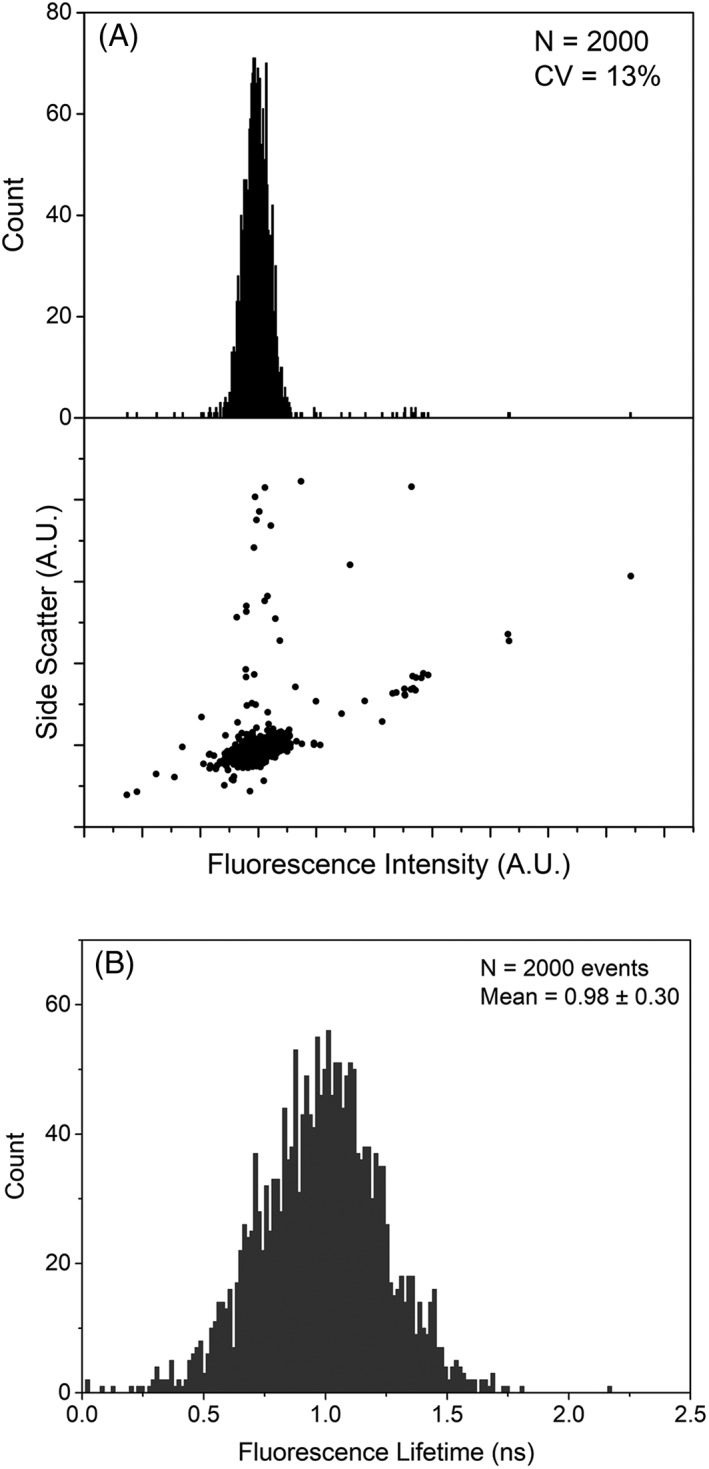
Figure 4.

Fluorescence intensity and fluorescence lifetime histograms for glacial blue fluorescent microspheres. (A) 1‐D fluorescence histogram and dot plot (scatter vs. fluorescence). The side scatter and fluorescence are the amplitude of the modulated signals after Fourier transformation. The glacial blue amplitude measured with the FLFC resulted in a CV of 13% indicating optimal alignment and performance of the flow cytometer. (B) Fluorescence lifetime histogram for 2,000 events of glacial blue microspheres. The mean fluorescence lifetime is 0.98 ns with standard deviation of 0.3 ns.
