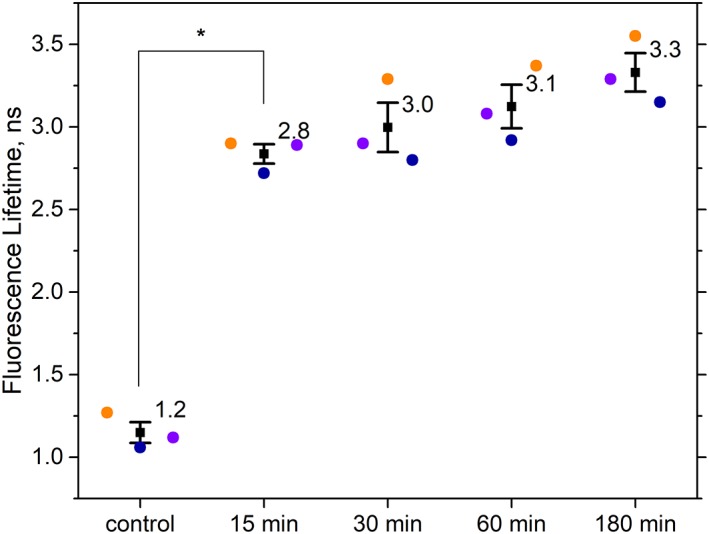
Figure 5.

Flow cytometric fluorescence lifetime measurements of HeLa cells before and after induction of apoptosis. Mean fluorescence lifetimes of cell samples (n ~3000) are plotted for three independent experimental repeats (purple, blue, and orange circles). Fluorescence lifetimes were calculated using the phase difference between a correlated side scatter and fluorescence modulated waveform signal for each cell. Data points shown are untreated HeLa cells (control), HeLa cells treated with 1 μM STS for 15 min, 30 min, 60 min, and 180 min. Mean of the three mean fluorescence lifetime values are plotted as a square with error bars showing standard error of means. Tukey post hoc test showed a significant difference in the fluorescence lifetime between control and cells treated with STS for 15 min, with P‐value <10e‐5. [Color figure can be viewed at wileyonlinelibrary.com]
