Figure 1.

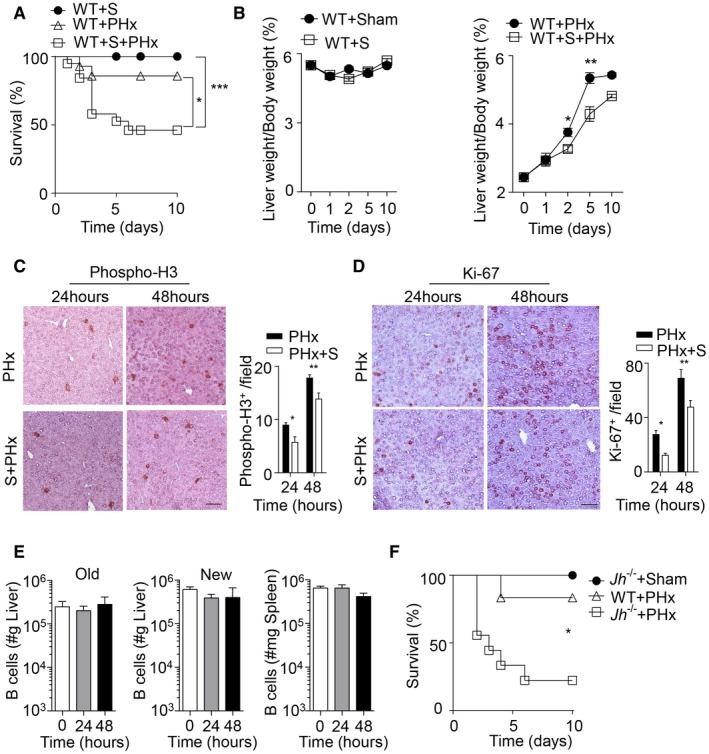
Decreased liver regeneration in splenectomized and B cell–deficient mice following PHx. (A) Survival of splenectomized, 70% PHx, and splenectomized mice followed by PHx (PHx+S) was monitored (n = 14‐19). (B) The liver weight/body weight ratio was determined at the indicated time points in WT sham‐operated mice and splenectomized mice (left panel) and in PHx WT mice and splenectomized mice (PHx+S) (right panel) (n = 3‐5). (C,D) Sections of snap‐frozen liver tissue from 70% PHx and splenectomized mice followed by PHx (PHx+S) at the indicated time points were stained with (C) anti‐phospho‐H3 and (D) anti‐Ki‐67 antibodies. Representative sections for each time point are shown (n = 4; scale bar, 100 μm). Right panels indicate quantification. (E) B‐cell numbers were determined by flow cytometry in the newly regenerated (“New,” n = 7‐8) and remaining (“Old,” n = 3‐4) liver lobes and spleen tissue (n = 7‐8) at indicated time points after 70% PHx. Results were calculated according to the liver (grams) and spleen (milligrams) weights. (F) Survival of Jh–/– mice (n = 9) after 70% PHx compared to sham‐operated Jh–/– mice (n = 3) and WT mice (n = 6). Error bars in all experiments represent SEM; *P < 0.05, **P < 0.01, ***P < 0.001. Abbreviation: S, splenectomy.
