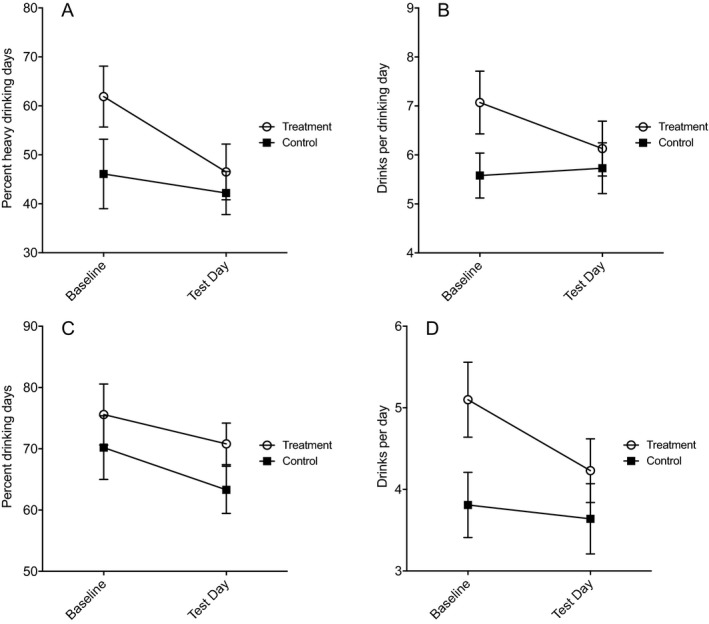
Figure 4.

Self‐reported drinking in participants who completed the study using the Timeline Followback interview method at baseline (90 days before study) and test day (during study period). There was no significant effect of treatment on percentage of heavy drinking days (A), drinks per drinking day (B), percent drinking days (C), or drinks per day (D), but a trend (p = 0.069) was observed indicating decreased drinks per drinking day in the treatment group compared with the control group (B). Values are presented as mean ± standard error of the mean.
