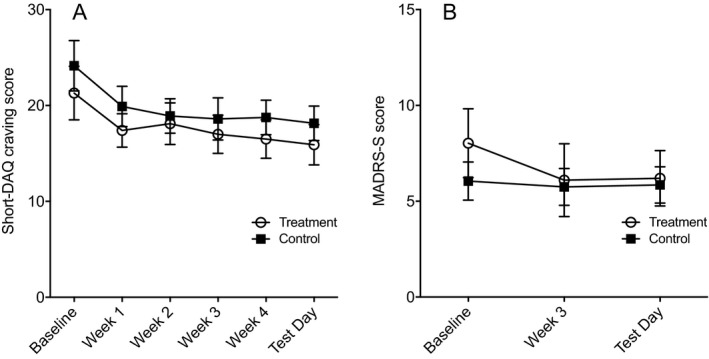
Figure 5.

Self‐reported craving (A) and mood (B) at baseline, weekly visits, and test day for treatment group and control group in participants who completed the study. There were no significant differences between treatment groups. Values are presented as mean ± standard error of the mean. Short‐DAQ, Swedish shortened version of the Desire for Alcohol Questionnaire; MADRS‐S, Montgomery–Asberg Depression Self‐Rating Scale.
