Figure 6.

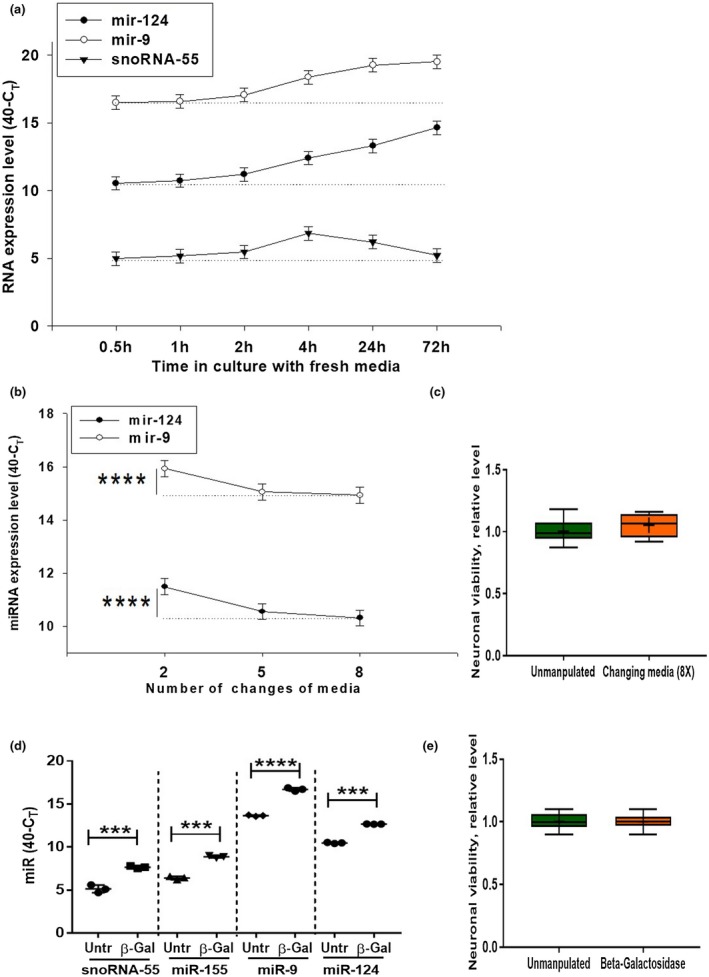
Kinetics of extracellular production of miR‐124 and miR‐9 by cultured cortical neurons. (a) Primary mouse cortical neurons were cultured as described in Material and Methods. The medium was changed once at 0 hr time point, and the expression of miR‐124, miR‐9, and snoRNA‐55 were assessed 0.5, 1, 2, 4, 24, and 72 hr later by real‐time RT PCR as described in Materials and Methods. (b, c) Primary mouse cortical neurons were cultured as described in Material and Methods. The medium was changed 2 or 5 or 8 times, and expression of miR‐124 and miR‐9 (b) or neuronal viability (c) were assessed by real‐time RT PCR or bioluminescent viability kit, respectively, as described in Materials and Methods. (d, e) Primary mouse cortical neurons were used untreated and treated with β‐galactosidase for 30 min (d, e), and the expression levels of miR‐124 and miR‐9 (d) or neuronal cell viability (e) were assessed by real‐time RT PCR or bioluminescent viability kit, respectively, as described in Materials and Methods. In (a, b), mean ± SD of five separate culture wells is shown. In (b), ****p < 0.0001, as determined by repeated measures ANOVA test (miR‐124: F(2,12) = 84.5; miR‐9: F(2,12) = 45.2). In (d), mean ± SD of three separate cell culture wells is shown (***p < 0.001; ****p < 0.0001 when compared to the same sample before the treatment with β‐galactosidase; paired Student's t test). In (c, e), mean ± SD of six separate cell culture wells is shown on box and whisker plot with the mean value indicated by “+” symbol [Colour figure can be viewed at wileyonlinelibrary.com]
