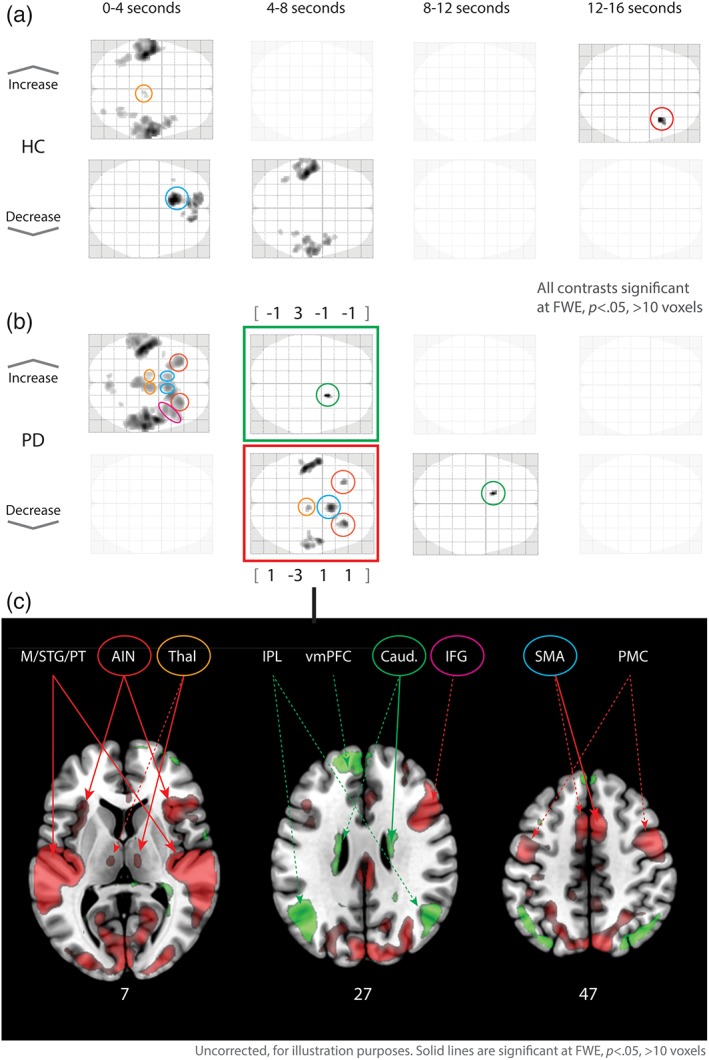
Figure 3.

Within‐group phasic contrasts for four time‐windows. Upper panels show phasic increased and decreased activation differences in the four 4 s time‐windows for healthy controls (upper) and the Parkinson's group (lower). Bottom panel shows (uncorrected) upregulated (green) and down‐regulated (red) areas in the second time‐window (4–8 seconds). Ring color corresponds to upper panels. Full lines show significant, dashed lines not‐significant contrasts at FWE, p < .05. M/STG/PT = medial/superior temporal gyrus/planum temporale, AIN = anterior inula, Thal = thalamus, IPL = inferior parietal lobule, vmPFC = ventromedial prefrontal cortex, Caud = caudate nucleus, IFG = inferior frontal gyrus, SMA = supplementary motor area, PMC = premotor cortex. Bottom numbers indicate axial coordinates
