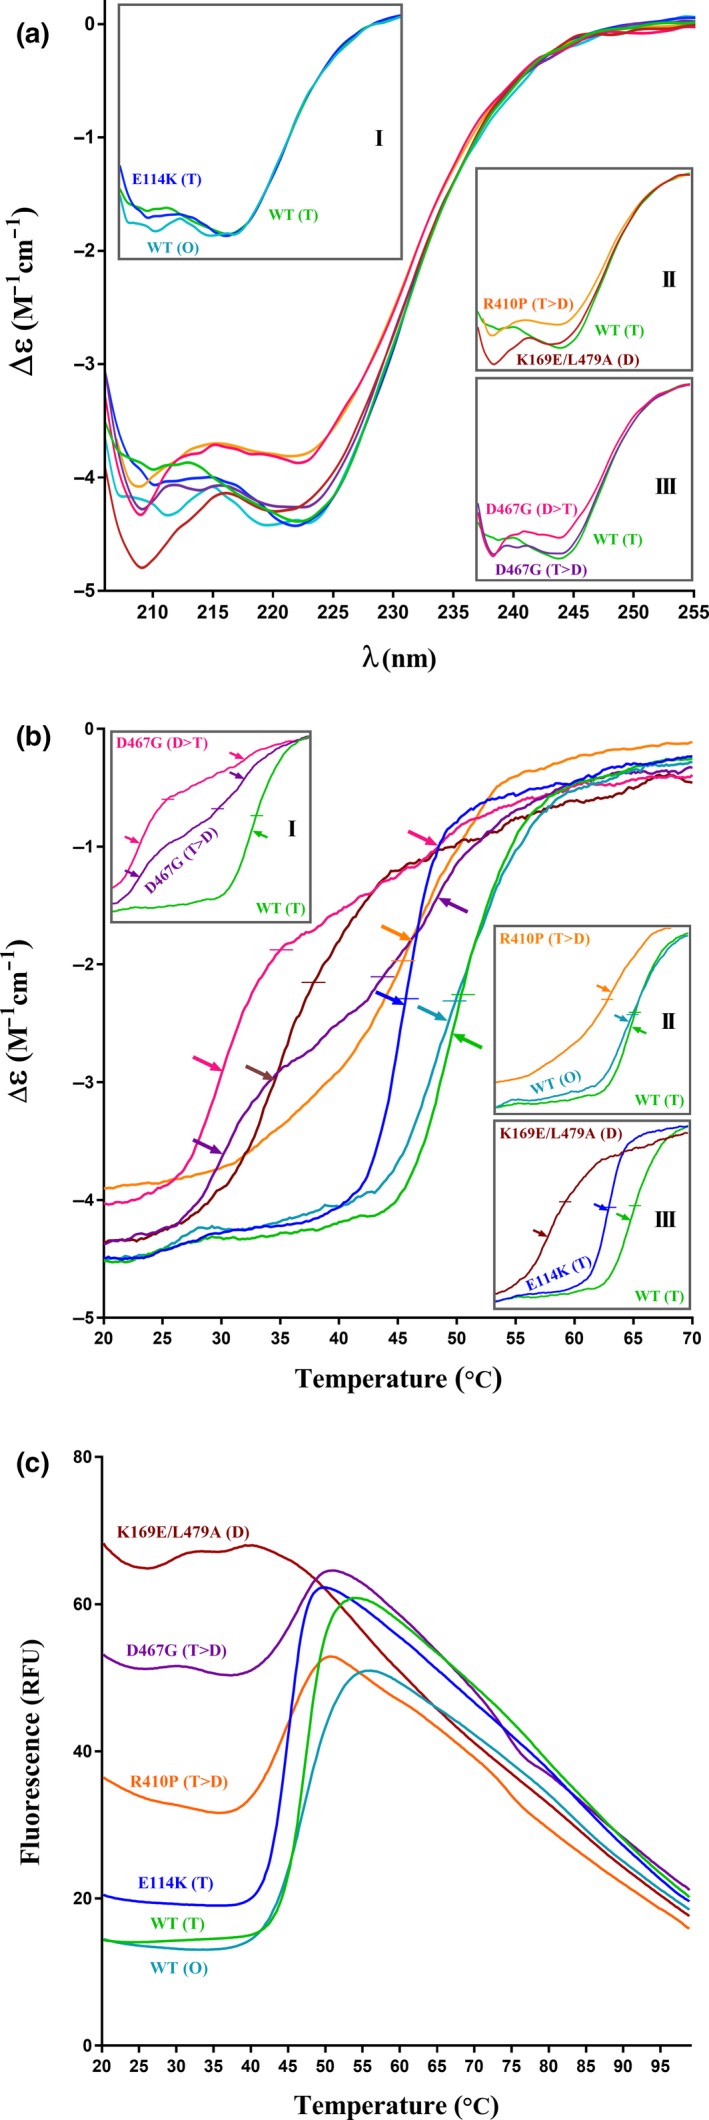
Figure 4.

CD spectra and thermal stability of WT and mutant proteins. (a) Spectra were measured between 205 and 270 nm (n = 3 replicates of each sample). The insets highlight key differences in helical content between the WT and mutants. (b) Thermal denaturation was measured at 222 nm over increasing temperatures as changes in CD signal. The top left inset presents the difference in thermal stability between tetramer‐enriched (T>D) and dimer‐enriched (D>T) fractions of D467G, indicating the instability of the dimeric form. T m (temperature at which the protein is half denatured) is shown with horizontal lines, whereas arrows highlight the first derivatives. For respective T m values, refer to the Table 2. (c) Differential scanning fluorimetry (DSF) analysis of thermal stability. The averaged T m values (n = 9 replicates of each sample) follow the trend that was drawn from the CD data (b).
