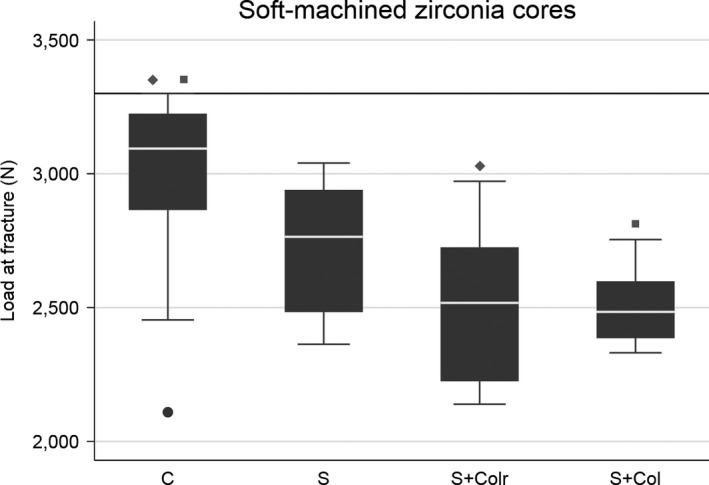
Figure 6.

Box plot of the four soft‐machined groups with different margin designs. Further load was stopped at 3,300 N (horizontal reference line at y‐axis) as a result of equipment limitation. The line within boxes represents the median, and the bottom and top of boxes represent the first and third quartiles, respectively. The maximum and minimum whiskers represent 1.5 interquartile ranges. Statistically significant differences between groups are marked with corresponding squares or diamonds. C, chamfer; S, slice; S + Colr, slice with cervical collar and reduced occlusal thickness; S + Col, slice with cervical collar.
