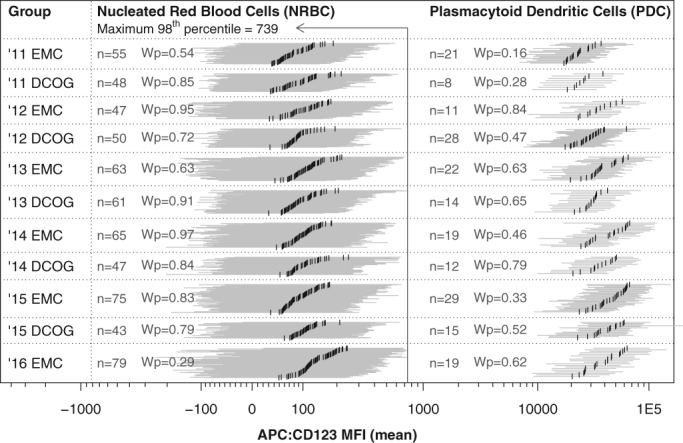
Figure 1.

Assay stability over time (2011–2016) and across laboratories (EMC and DCOG). Evaluation based on normal NRBC and normal PDC (as negative and positive control, respectively). Visualization per individual population, where the horizontal gray bars visualize the 96% interval and the vertical black bars visualize the median CD123 expression (CD123‐MFI). Solid vertical line indicates the highest 98 percentile found among all NRBC populations, which was used as positivity cut‐off during CD123‐PPC analysis. For each subgroup, the Wilcoxon signed‐rank test result is shown, comparing the subgroup against the remainder of populations (Wp denotes the probability value after Bonferroni correction). One‐way ANOVA did not reveal any significant differences among the NRBC and PDC subgroups as well (both tests P > 0.05). The Bartlett test, Fligner‐Killeen test, and Brown–Forsythe tests, comparing all PDC subgroups at once, did not reveal any significant differences as well (P = 0.154, P = 0.065, P = 0.075, respectively). In conclusion, evaluated subgroups have comparable distributions and variances, confirming assay stability over time and across centers.
