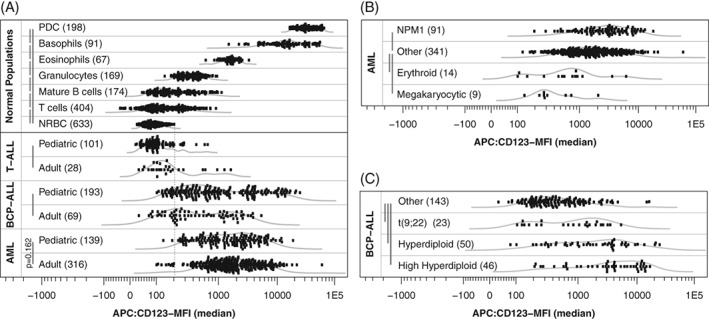
Figure 2.

CD123 median fluorescence intensity (CD123‐MFI) for normal mature leukocyte subsets and acute leukemia. Curved gray lines visualize Gaussian kernel density estimation. Vertical gray bars visualize performed Wilcoxon signed‐rank tests (P‐value after Bonferroni multiple testing correction was smaller than 0.001 unless otherwise specified). (A) CD123‐MFI for AML, BCP‐ALL, and T‐ALL patients and various normal populations. Vertical dotted line represents the highest CD123‐MFI among evaluated NRBC populations. (B) CD123‐MFI levels for selected AML subgroups. (C) CD123‐MFI levels for selected BCP‐ALL subgroups.
