
Figure 4.
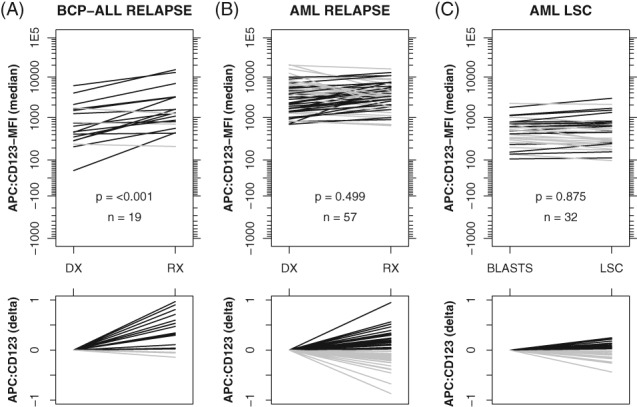
Paired evaluations (diagnosis versus relapse and leukemic blasts vs. leukemic stem cells). Initial diagnosis (DX) versus relapse (RX) for BCP‐ALL patients (A) and AML patients (B). Leukemic blasts versus LSCs in AML patients (C). Black bars indicate increased CD123‐MFI while gray bars indicate decreased CD123‐MFI (right vs. left side). Lower panels visualize the delta CD123 expression (after default logicle transformation), thereby clearly visualizing the magnitude and direction of changes. Reported P‐values are based on a paired Mann–Whitney U test.