
Figure 5.
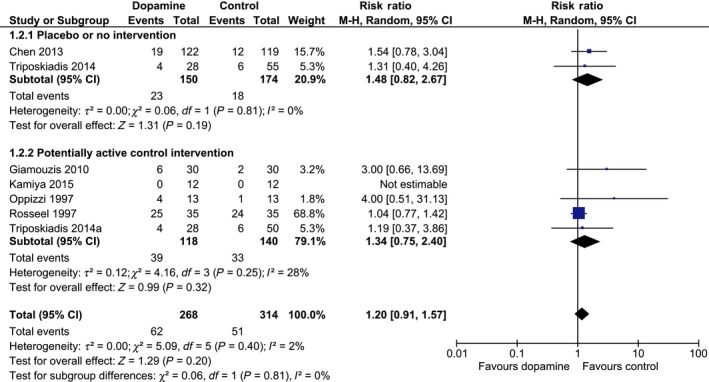
Forest plot of serious adverse events in trials stratified by intervention. Forest plot of serious adverse events in all trials stratified by intervention. Size of squares for risk ratio (RR) reflects the weight of the trial in the meta‐analysis. Horizontal bars are 95% confidence intervals (CI) [Colour figure can be viewed at wileyonlinelibrary.com]