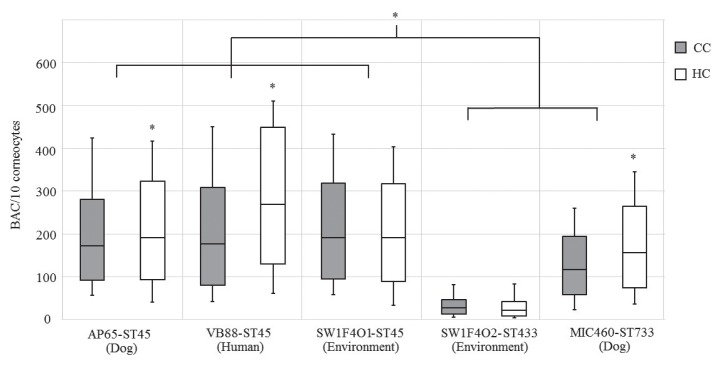
Figure 1.
Box plots representing bacterial adhesion counts (BACs) of 5 methicillin-resistant Staphylococcus pseudintermedius (MRSP) isolates on canine corneocytes (CC) and human corneocytes (HC). The top and bottom of the box represent lower quartile and upper quartile. The line in the box is the median and the whisker is the range of the data. The asterisk indicates a statistically significant difference at P < 0.05.

