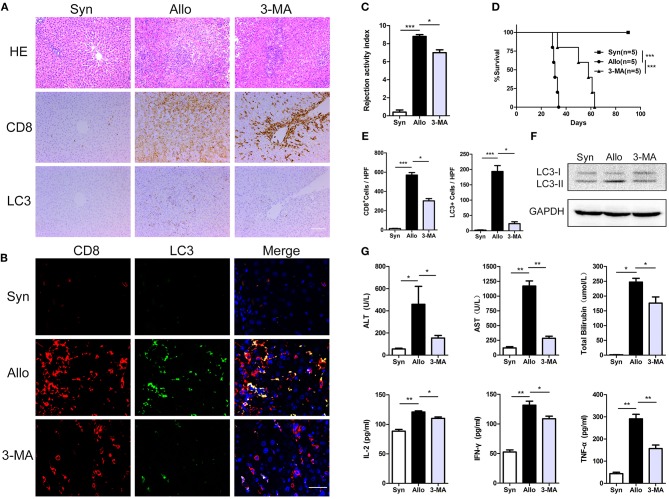
Figure 3.
Inhibition of autophagy significantly prolonged recipient survival. All samples were collected on day 14 after liver transplantation. (A), Hematoxylin and eosin staining and immunostaining for CD8 and the autophagy marker LC3 in allogenic group, allogenic group and 3-MA group rat recipients. Scale bar, 100 μm. (B) Double fluorescent staining for CD8 (red), LC3 (green) and DAPI (blue) in liver grafts. (C) Bar graph showing the rejection activity index (RAI) results in three groups. (D) Survival of rat recipients was compared between three groups (log rank, p < 0.001). (E) Histogram showing the counts of CD8 positive and LC3 positive cells in three groups. (F) Expression of LC3 in CD8+ T cells isolated from liver grafts was further determined by western blot. (G) Analysis of serum levels of ALT, AST, and TBIL, and cytokine (IFN-γ, IL-2, and TNF-α). Apart from log-rank used in survival test, the rest statistical analyses were performed by student t-test, *p < 0.05, **p < 0.01, ***p < 0.001 compared between groups.

