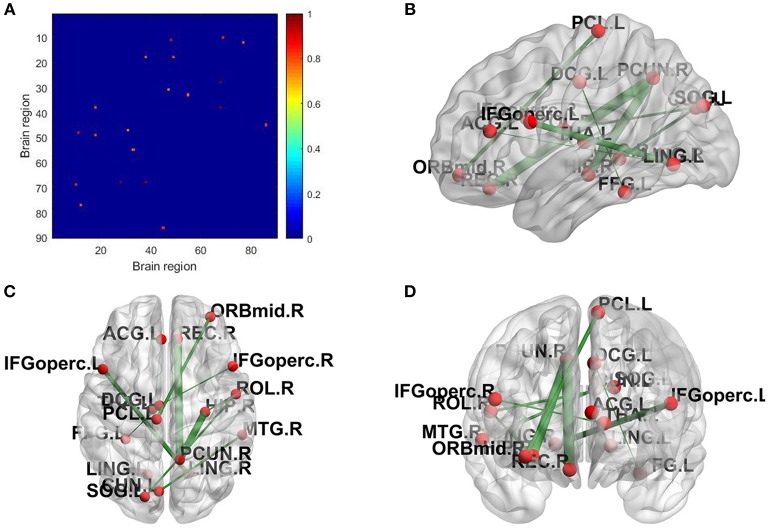
Figure 4.
SAC between schizophrenia and healthy controls (Top 10). Brain network connectivities with the top 10 discrimination ability. In (A), the position in the i-th row and j-th column indicates connectivity between the i-th brain region and the j-th brain region, and the weight can be judged by the corresponding color. (B–D) show the top 10 alteration connectivities for identifying schizophrenia.

