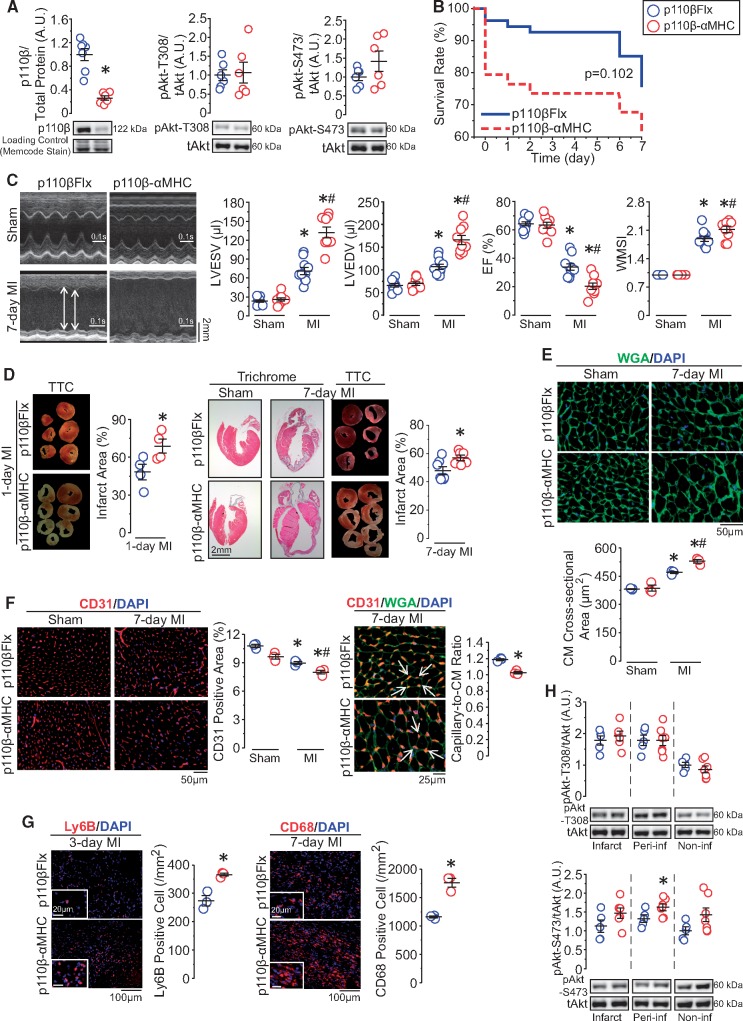
Figure 4.
CM-specific inactivation of p110β exacerbates cardiac dysfunction after MI, resulting in adverse ventricular remodelling. (A) Western blot analysis of p110β and Akt levels in p110β-αMHC and p110βFlx left ventricular lysates. *P < 0.05, n = 6–7 mice/group (t-test). (B) Kaplan–Meier survival analysis in post-MI p110β-αMHC and control mice, n = 34–54 mice/group (log-rank test). (C) Echocardiographic images showing left ventricular morphology and functional analysis of left ventricular end-systolic and end-diastolic volume (LVESV and LVEDV), ejection fraction (EF), and wall motion score index (WMSI). *P < 0.05 vs. sham, #P < 0.05 vs. p110βFlx, n = 9–10 mice/group (one-way ANOVA). (D) Trichrome histological-stained images and TTC-stained images and infarct size quantification on post-MI hearts. *P < 0.05, n = 4–7 mice/group (t-test). (E) Wheat Germ Agglutinin (WGA, green) immunofluorescence staining outlining CM size. *P < 0.05 vs. sham, #P < 0.05 vs. p110βFlx, n = 3 mice/group (one-way ANOVA). (F) Vascular density and capillary-to-CM ratio testing by CD31 (red) and WGA (green) immunofluorescence staining on post-surgery hearts. *P < 0.05 vs. sham/indicated group, #P < 0.05 vs. p110βFlx, n = 3 mice/group (one-way ANOVA or t-test). (G) Neutrophils identified by Ly6B (red, left panels) and macrophages marked by CD68 (red, right panels) immunofluorescence staining on post-MI hearts. *P < 0.05, n = 3 mice/group (t-test). (H) Western blot analysis of Akt protein level in 7-day post-MI hearts. *P < 0.05 vs. p110βFlx, n = 5–7 mice/group (t-test).

