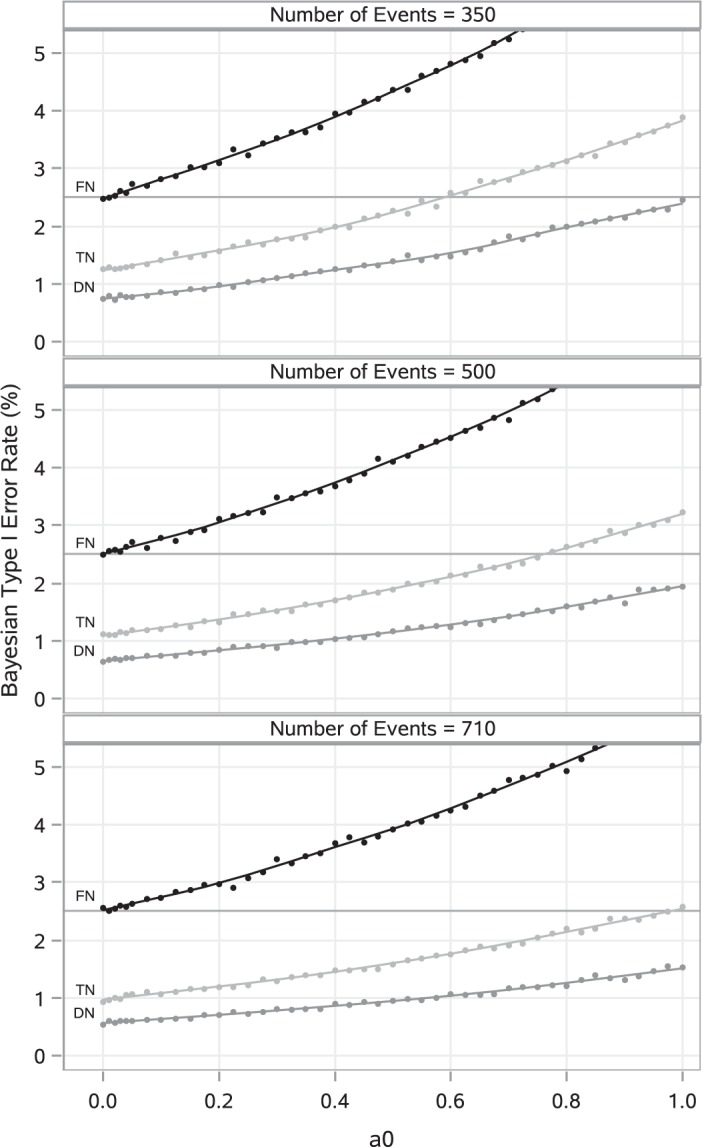
Fig. 2.

LOESS curves and point estimates for Bayesian type I error rate as a function of  for
for  , and
, and  for each null sampling prior. Each point estimate is based on 100 000 simulation studies.

LOESS curves and point estimates for Bayesian type I error rate as a function of  for
for  , and
, and  for each null sampling prior. Each point estimate is based on 100 000 simulation studies.