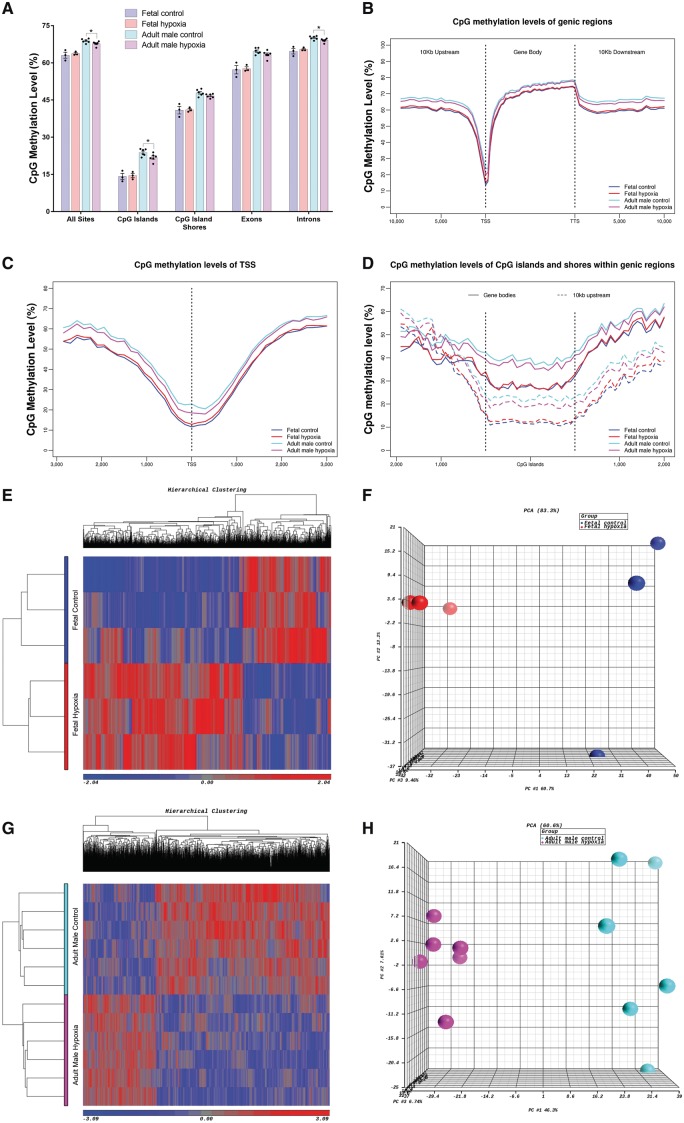
Figure 1.
Genome-wide CpG sites methylation in relation to genomic features and hypoxia-induced DMRs. (A) Average CpG methylation levels for various genomic features. Data are expressed as mean ± SEM. Statistical significance was calculated by one-way ANOVA. *P < 0.05. CpG methylation levels in relation to (B) genic regions, (C) TSS, and (D) CGI and CGS within gene bodies and up to 10 kb upstream of TSS. Heatmap and PCA plot of DMRs between the control and hypoxia groups in (E, F) foetal rats and (G, H) adult male rats. n = 3 in foetal control/hypoxia group; n = 6 in adult control/hypoxia group.

