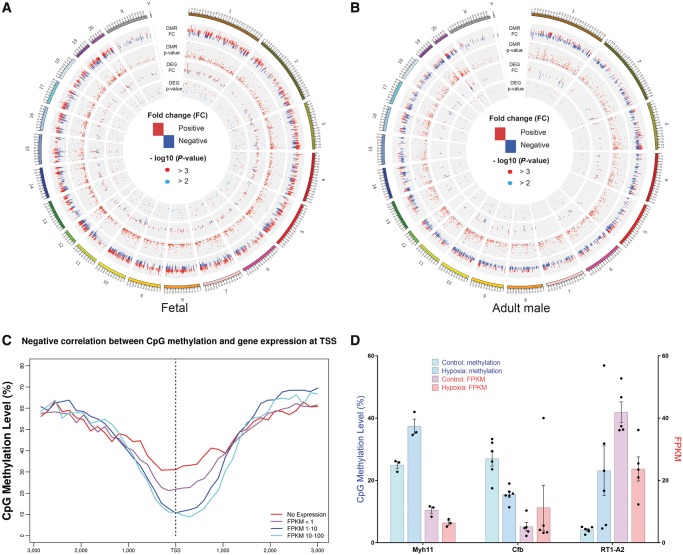
Figure 3.
Integration of DMRs and DEGs. (A, B) Circos plot of DMRs and DEGs in foetal and adult male rats. Positive fold-changes in DMRs represent hypermethylation in hypoxia group while negative fold-changes in DMRs represent hypermethylation in control group. Positive fold-changes in DEGs represent up-regulation in hypoxia group while negative fold-changes in DEGs represent up-regulation in control group. Red dots represent P-value <0.001 while blue dots represent 0.001 ≤ P-value <0.01 (n = 3–6). (C) Negative correlation between CpG methylation and gene expression at TSS. (D) Three example genes (Myh11, Cfb, and RT1-A2) with DMRs located in promoter regions show a negative correlation between gene expression (FPKM) and methylation rate (beta value) of CpG regions under control and hypoxia environment. Data are expressed as mean ± SEM. n = 3–6.

