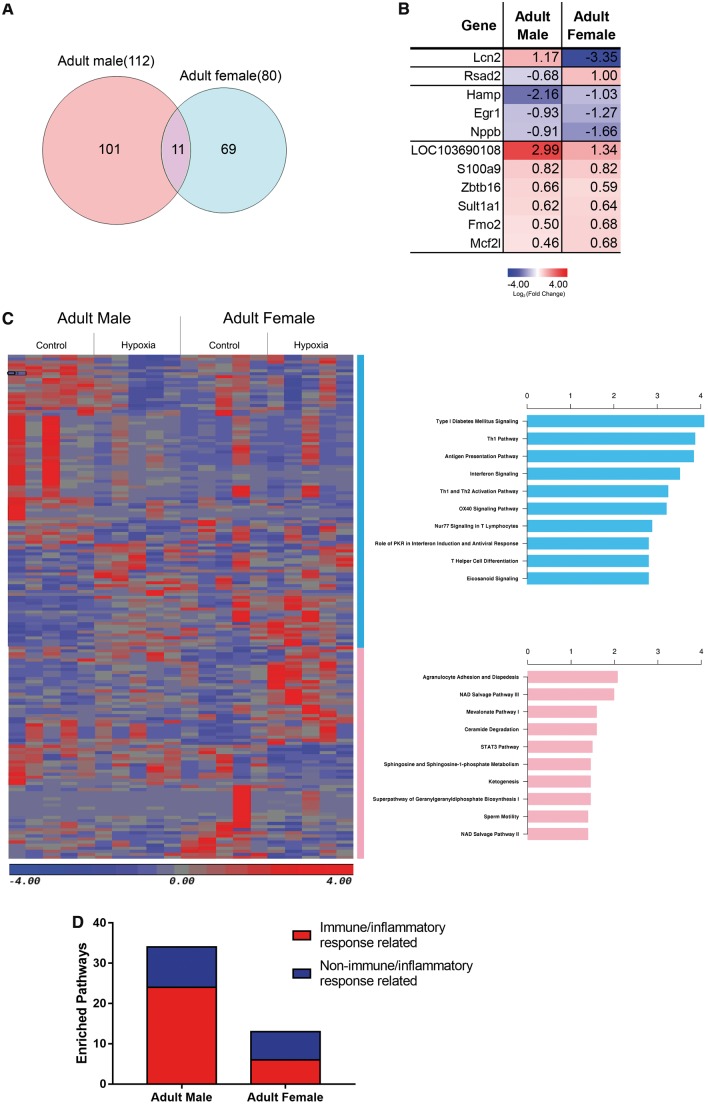
Figure 6.
Sex-specific DEGs. (A) Venn diagram of the hypoxia-induced DEGs in adult male and female heart. (B) Average gene expression of antenatal hypoxia exposed group compared with control group in male and female rat heart over the 11 overlapped genes. (C) Heatmap and top 10 canonical pathways of the exclusive DEGs between hypoxia and control group in adult male and female rats. (D) Number of immune/inflammatory response related pathways over all enriched pathways in adult male and female heart exposed to antenatal hypoxia. n = 5 for each group.

