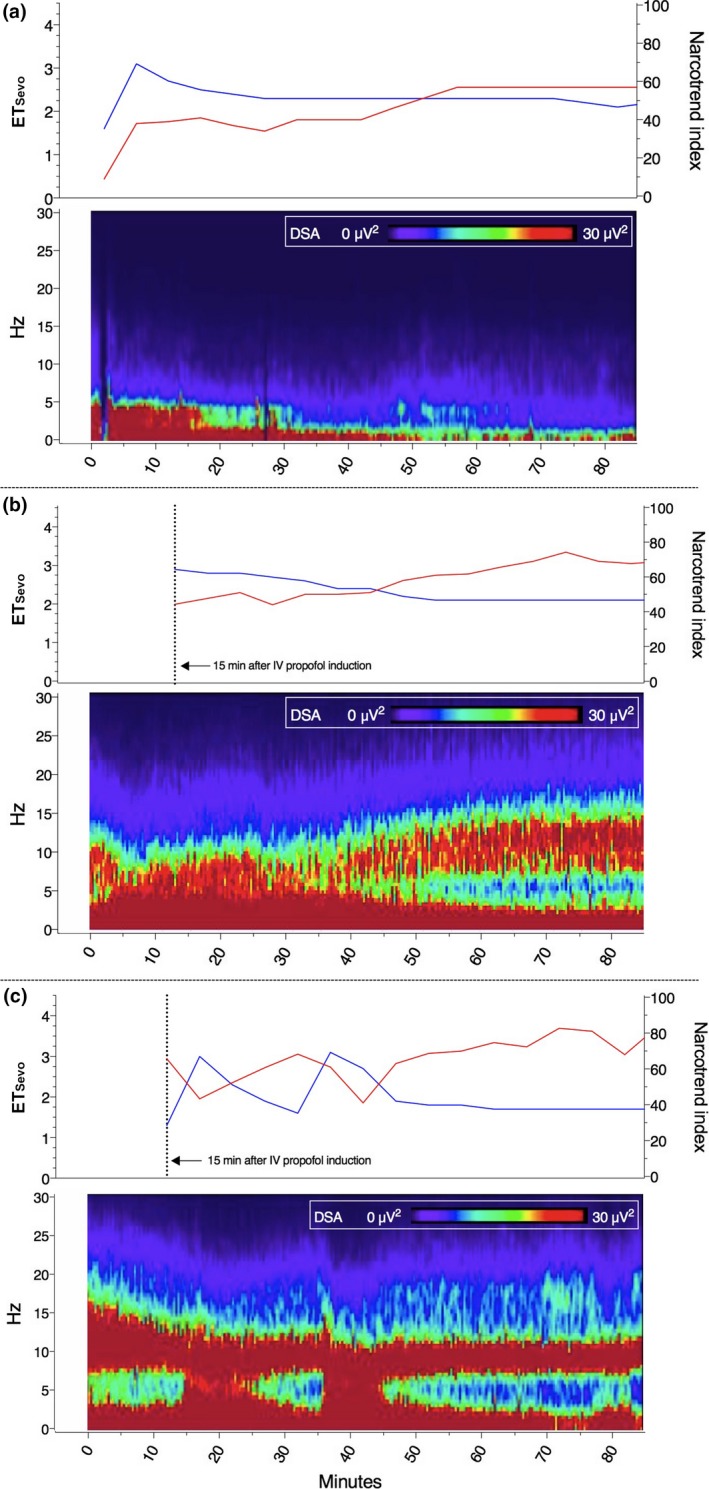
Figure 2.

Examples of the relationship between the ETsevo concentration, the Narcotrend index and the density spectral array (DSA) colour spectrum in each age group; (a) represents a 3‐month‐old infant, a 9‐month‐old infant is represented in (b), and (c) represents a 38‐month‐old child. The red line indicates Narcotrend index and the blue line ETsevo concentration.
