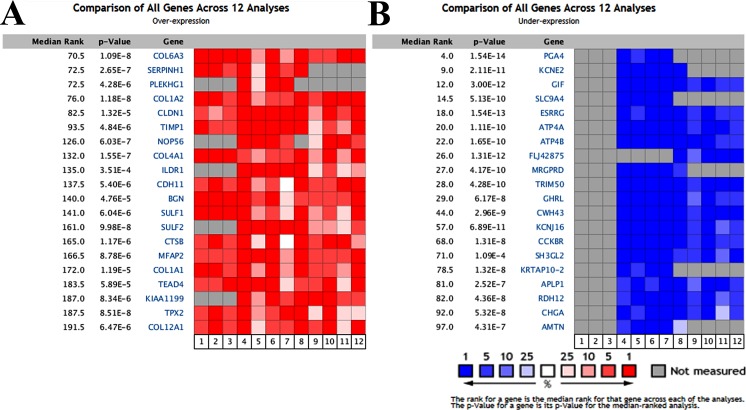
Figure 1. Transcriptional heat map of the top 20 over- and underexpressed genes in gastric cancer samples compared with normal samples through Oncomine analysis.
The level plots depict the frequencies (%) of (A) over- and (B) underexpressed candidate messenger RNAs (mRNAs) in 12 analyses from five included studies (Chen et al., 2003; Cho et al., 2011; Cui et al., 2011; D’Errico et al., 2009; Wang et al., 2012). Red cells represent overexpression. Blue cells represent underexpression. Gray cells represent not measured.

