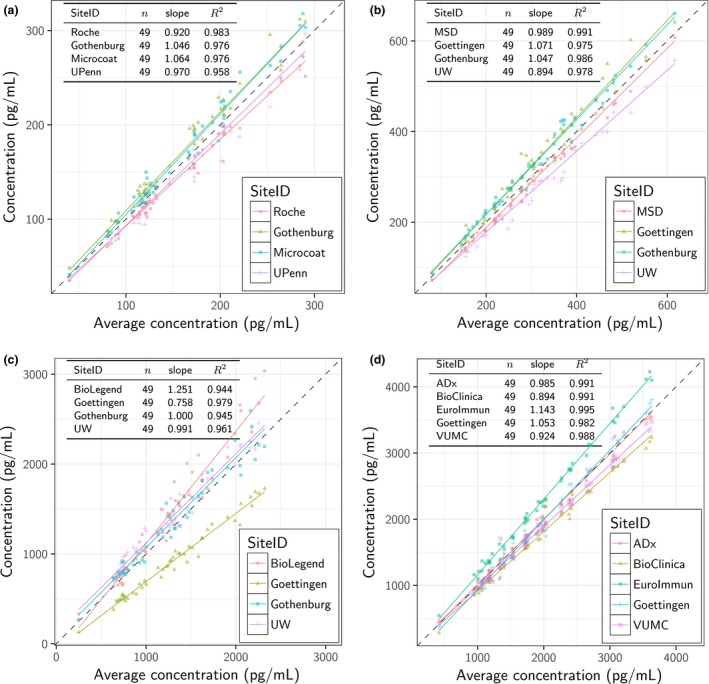
Figure 1.

Scatter plots for MSD (a), BioLegend (b), ADx (c), and Roche (d) CSF α‐synuclein assays. On the y‐axis of each panel, each sample's concentration per site (i.e., averaged across replicates and kit lots) is shown. The corresponding average concentration across all sites is given on the x axis. The results from linear regression of each site's concentrations against the average are shown, with corresponding number of the 49 samples, slope, and coefficient of determination (R 2). The dotted line indicates x = y.
