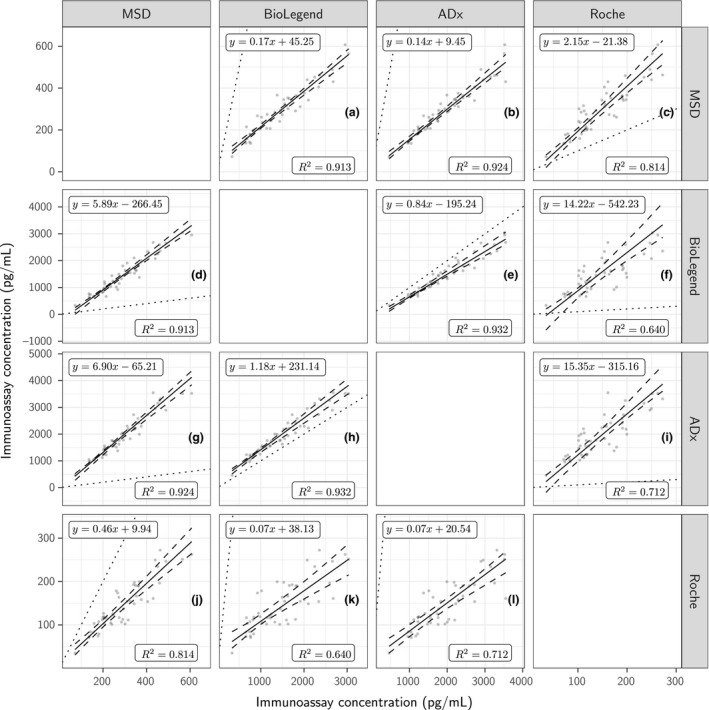
Figure 3.

Relationship between the CSF α‐synuclein concentrations for MSD in y against BioLegend (a), ADx (b), and Roche (c) in x; for BioLegend in y against MSD (d), ADx (e), and Roche (f) in x; for ADx in y against MSD (g), BioLegend (h), and Roche (I) in x; and Roche in y against MSD (j), BioLegend (k), and ADx (l) in x. All concentrations of 49 samples measured at the originating laboratories (the laboratories that developed the respective assay) and have been averaged across replicates and kit lots.
