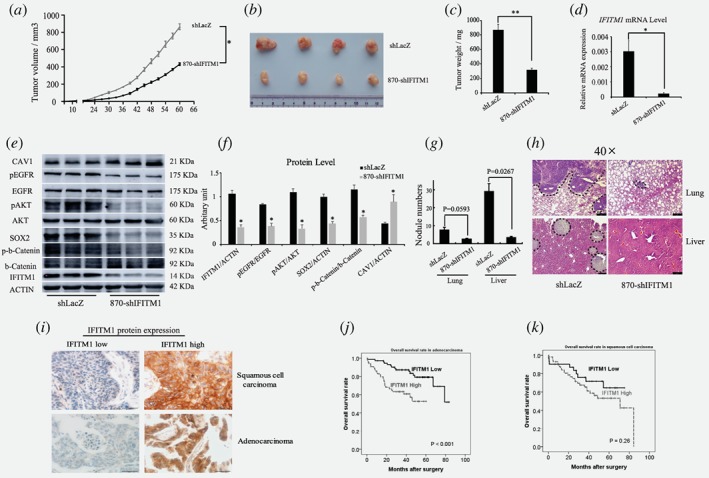
Figure 6.

IFITM1 is required for the progression of lung cancer in vivo, and is associated with a poor prognosis of adenocarcinoma patients. (a‐c) Control (shLacZ) or IFITM1‐depleted (870‐shIFITM1) H1650 cells were subcutaneously injected into NSG mice, and then mice were monitored for tumor growth. (a) Tumor volume was measured every 3 days up to 60 days and the tumor growth curve displayed over time. (b) A representative image of tumors was shown. (c) Tumors isolated from each mouse were weighed. (d) RNA was isolated from each tumor and IFITM1 expression was analyzed by RT‐qPCR. (e, f) Cell lysates obtained from each tumor were analyzed by immunoblots to determine the expression of key signaling molecules indicated. A representative image was shown (e) and the image intensity was analyzed by Image J and quantified (f). The data are shown as mean ± SEM (n = 6, *p < 0.05, **p < 0.001). (g and h) Control (shLacZ) or IFITM1‐depleted (870‐shIFITM1) H1650 cells were orthotopically injected into the lungs of NSG mice, and then mice were monitored for tumor metastasis. (g) Quantification of the number of nodules in the lungs and liver (shLacZ, n = 3; 870‐shIFITM1, n = 2). (h) Representative images of HE staining. The dotted lines indicated the area of tumor nodules. (i‐k) A total of 226 NSCLC patients‐derived cancer samples were stained with IFITM1 antibody and evaluated based on staining frequency. (i) Representative images of immunohistochemistry are shown. Survival rates of adenocarcinoma (j) and squamous cell carcinoma (k) were determined based on the expression of IFITM1 expression using Kaplan–Meier curve (j, p < 0.001; k, p = 0.26). [Color figure can be viewed at wileyonlinelibrary.com]
