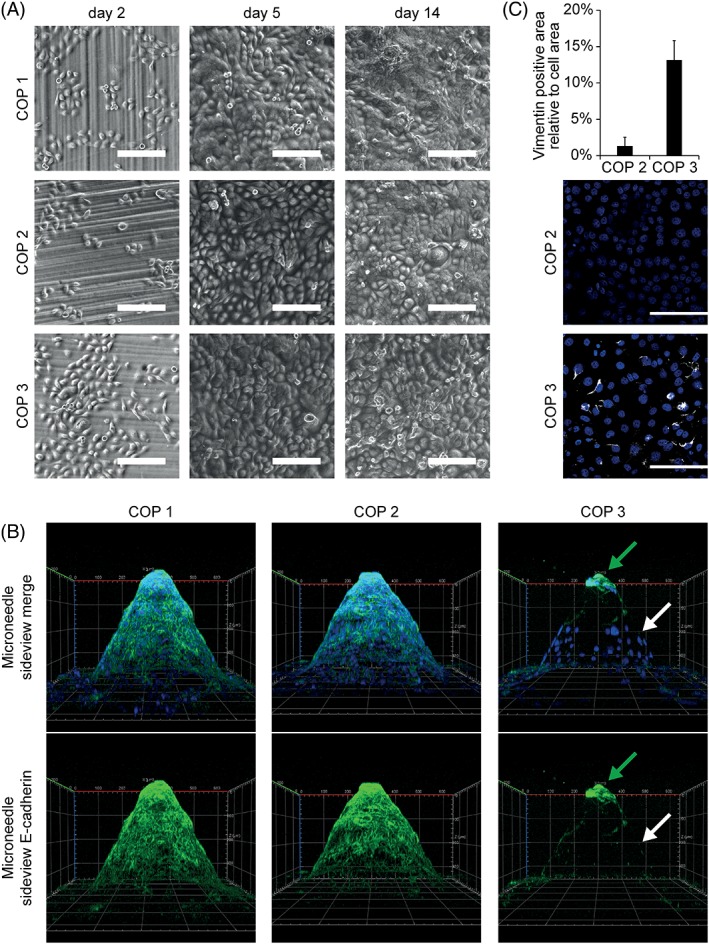
Figure 5.

Differences in cell–cell barrier and EMT markers in human keratinocytes after incubation in direct contact with COP materials. (A) Cells were seeded on top of microneedle arrays in direct contact with the material and observed by brightfield microscopy at indicated time points. (B) After 14 days cells were stained with Alexa‐488 labeled E‐cadherin Antibody (cell–cell contacts—green) and DAPI (cell nuclei—blue). HaCaT cells seeded on top of material three showed less E‐cadherin expression after 14 days in culture. White arrow marks keratinocytes without E‐cadherin expression. Green arrow marks E‐cadherin positive keratinocytes on needle tip with limited contact to COP 3. Representative 3D images of three independent experiments are shown. X‐axis and Y‐axis equal 600 μm, Z‐axis equals 350 μm. (C) HaCaT cells seeded on top of COP 3 showed increased expression of EMT marker vimentin after 14 days in culture. Cells were seeded on top of microneedles in direct contact with the material. After 14 days cells were stained with directly labeled vimentin antibody and vimentin positive area per total cell area was quantified for three high power fields per condition. Mean +/‐SD n = 3.
