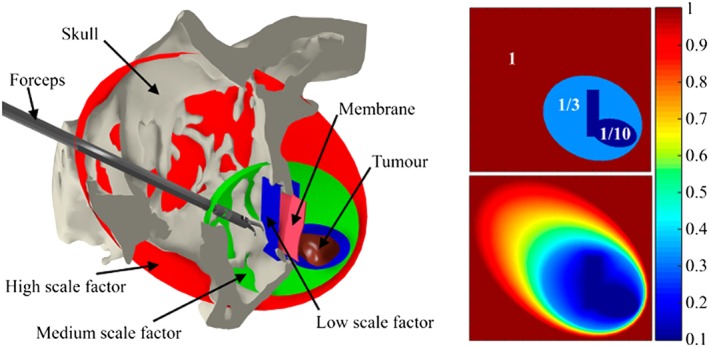
Figure 9.

(Left) Sagittal slice of the skull that reveals the membrane, tumour, and forceps, where closed meshes represent the scaling zones. (Right) Colour map visualisation of the motion scaling factor sampled on the sagittal plane without interpolation (above), and with linear interpolation (below)
