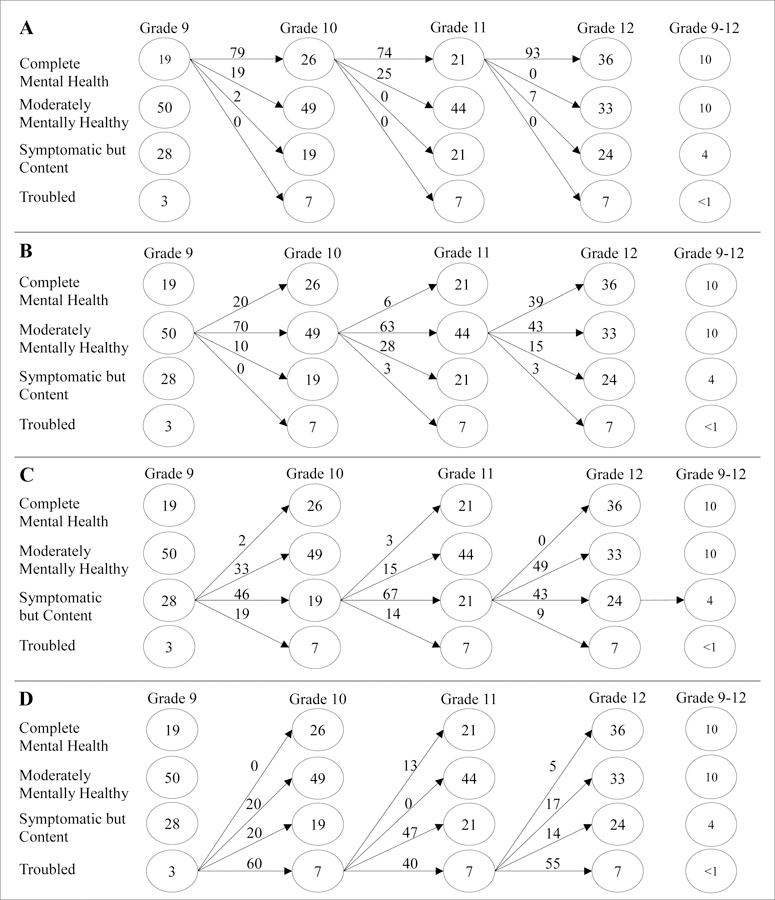
Figure 2.

Four-year stability patterns for each of the (A) complete mental health, (B) moderately mentally healthy, (C) symptomatic but content, and (D) troubled profiles, respectively, based on the final estimated LTA model from Grade 9 to Grade 12. Numbers in circles refer to percent of students in each mental health profile. Numbers above arrows indicate the percentage of students who transition from one mental health profile to another.
