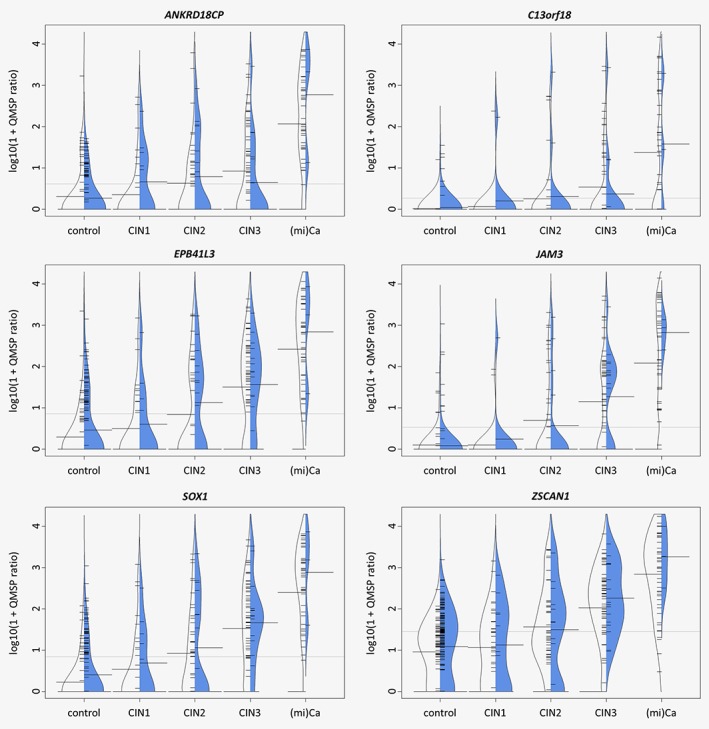
Figure 2.

Asymmetric beanplots of methylation level distributions across histology and between study populations [Slovenian scrapings (n = 235) in blue and previously analysed Dutch scrapings (n = 278) in white]. Small horizontal bars indicate individual samples, large horizontal bars indicate the geometric mean methylation ratio per group and the dotted line signifies the grand geometric mean. [Color figure can be viewed at wileyonlinelibrary.com]
