Figure 3.

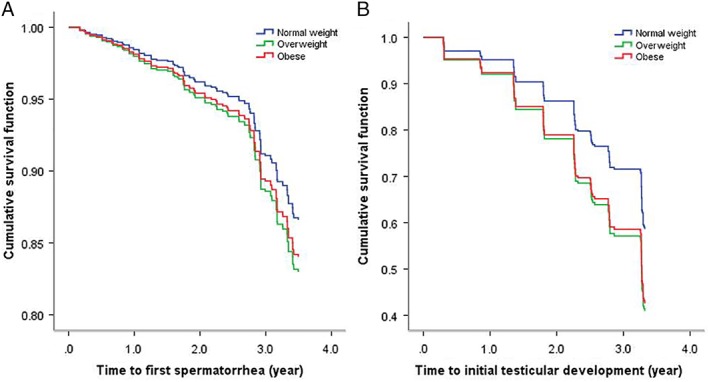
Survival curves for first spermatorrhea and testicular development as end points comparing normal weight, overweight and obese groups, adjusted for age

Survival curves for first spermatorrhea and testicular development as end points comparing normal weight, overweight and obese groups, adjusted for age