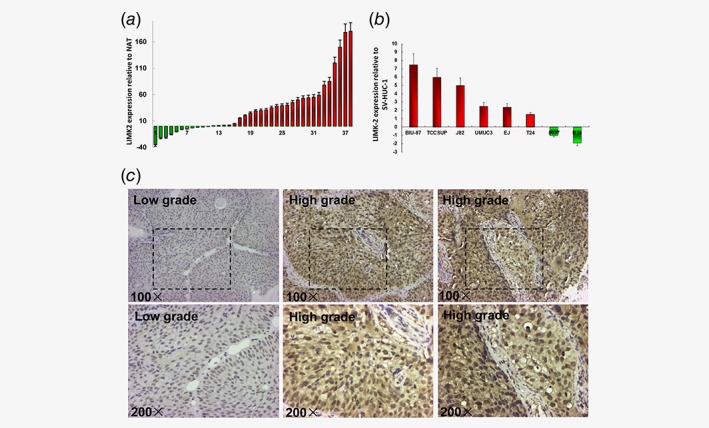
Figure 1.

LIMK2 expression in human bladder cell lines, tumors or normal adjacent tissues. (a) Expression of LIMK2 in 38 bladder cancer tissue samples relative to normal adjacent tissues (NAT). Columns above the X‐axis indicate higher expression of LIMK2 while those below the X‐axis indicate lower expression of LIMK2 relative to NAT. (b) LIMK2 mRNA expression levels in bladder cancer cell lines relative to normal urothelial cells (SV‐HUC‐1). Columns above the X‐axis indicate overexpression of LIMK2 while those below the X‐axis indicate under expression of LIMK2 relative to normal cells. (c) Representative LIMK2 immunohistochemical staining of bladder cancer tissues. Images are × 100 and × 200. Staining: brown, LIMK2.
