
Figure 7.
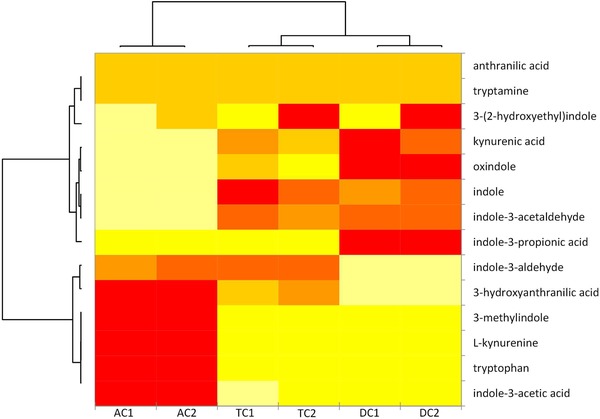
Heat map of tryptophan and tryptophan derivatives, from yellow (lower concentration) to red (higher concentration). Ascending colon (AC), transverse colon (TC), and descending colon (DC) of donor 1 and 2. The concentrations (nm) are reported in Figure S2, Supporting Information.