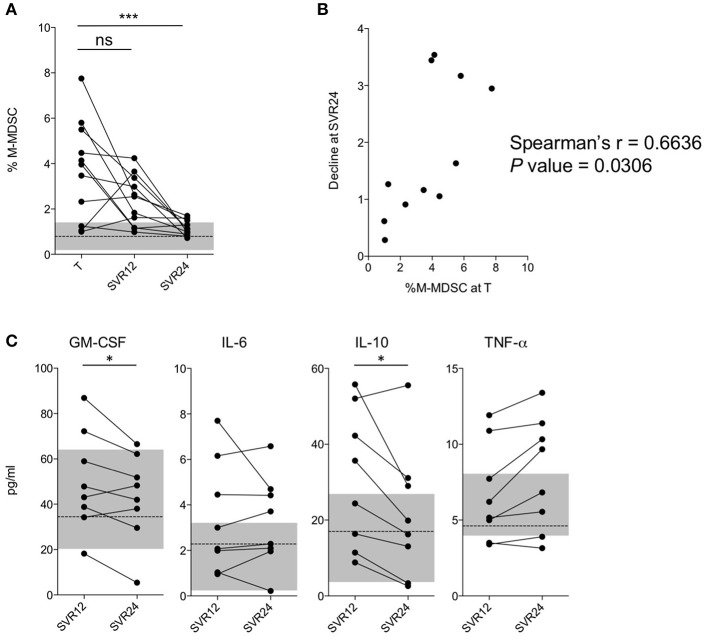
Figure 2.
Analysis of M-MDSC frequencies in a longitudinal cohort. (A) Percentage of M-MDSCs in subjects with HCV-chronic infection (nested longitudinal cohort, n = 11) during treatment (T), at SVR12, and at SVR24. The dashed line represents the median value of M-MDSC percentages in HC (n = 38), and the gray area the interquartile range. (B) Correlation between the percentage of M-MDSCs during treatment (T) and the ratio between the percentage at time T and SVR24 (longitudinal cohort, n = 11). (C) Cytokines levels in subjects with HCV-chronic infection at SVR12 and at SVR24 (longitudinal cohort, n = 8). The dashed line represents the median concentrations in HC (n = 14), and the gray area the interquartile range. ns, not significant, *P < 0.05, ***P < 0.0001 calculated by one-way repeated measures ANOVA followed by the Bonferroni's post-test (A) or by Wilcoxon signed-rank test (C). Correlations were calculated by Spearman's rank test (B).

